Fact Sheets Tree Map
Add to
Sign In
Use Your LeanIX Workspace
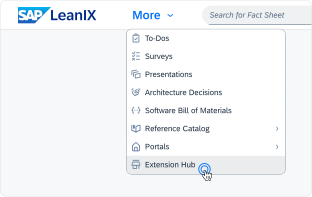
Click 'More' in the main navigation, then select 'Extension Hub'.
You will be signed in automatically.
Change Log
No version history available.
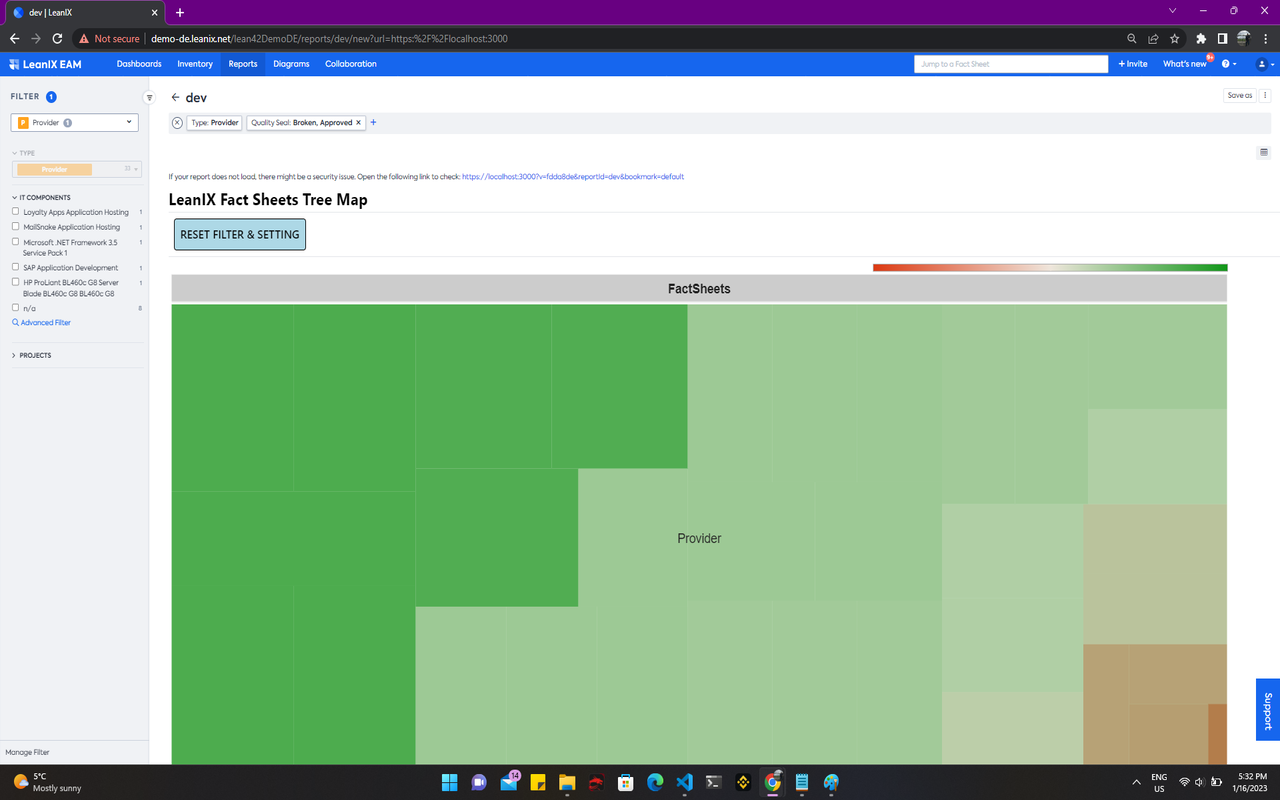
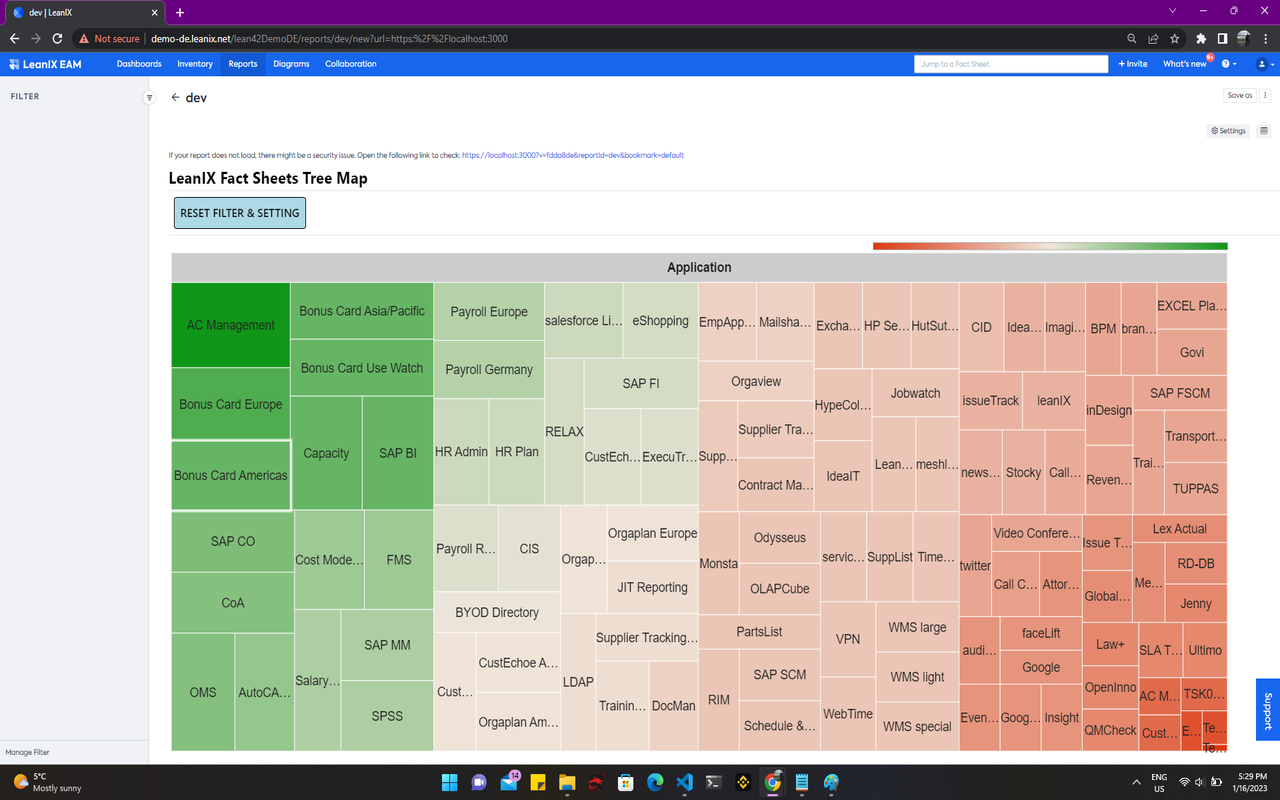
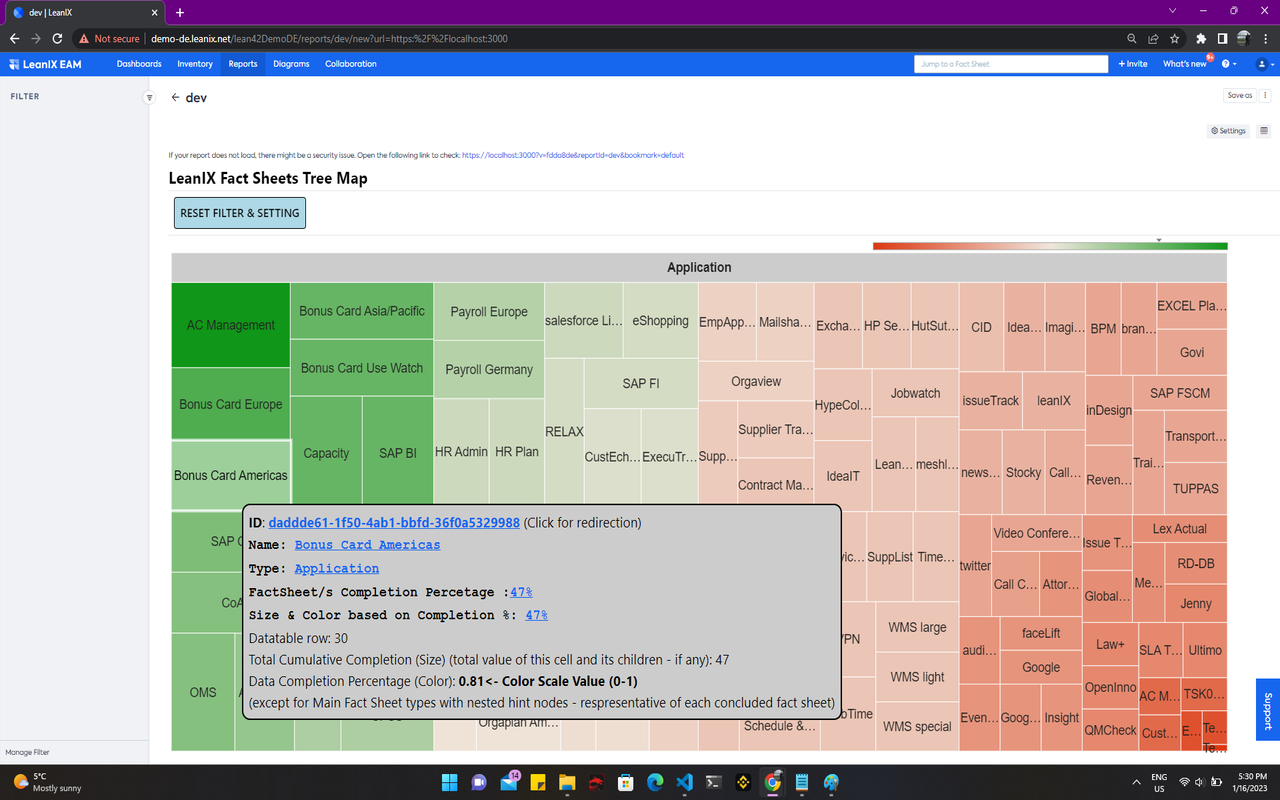
The Fact Sheets Tree Map Report (using Google Charts), is a visualization of all fact sheet types and their associated children fact sheets. Initially, when the report is loaded, all fact sheets are presented with their size and color being based on each respective fact sheet's data completeness percentage value and a scale that is configurable (in the case of this report 0-100). Rectangles representative of fact sheet types do not have a single color but are rather composed of varying colors since the color can vary according to amount of sub-related fact sheets and their data completeness values (method of using "hinted nodes" as described by the Google Charts documentation). When clicking on a fact sheet type rectangle, a drill-down can be initiated which is to result in the visualization of all sub-related fact sheets. The drill-down level for this report is 2 and leaf fact sheets can be reached. The report also makes use of the "Settings" button, a custom reset button and a custom tooltip that shows when hovering over the tree map items.
Details
The report is configured automatically and supports all fact sheet types and all facet filters per chosen fact sheet type. A fact sheet can be picked from the "Settings" button at the upper-right corner of the screen for visualizing an individual fact sheet tree map. Once a fact sheet is picked, fact filters can be applied from the left side filters section. The "RESET FILTER & SETTING" button serves to reset the report and visualize all root/ parent fact sheets together. Facet filters cannot be applied when the root fact sheet types have been used for the report (on load and on reset). The report also makes use of a tooltip that is displayed whenever hovering on top of a rectangle from the tree map.
Configured data fields and specific tags are not required by this report. All Fact Sheet data is required for this report. The report does not make use of any mutations.