Area Chart: User Groups and IT Components per Application
Add to
Sign In
Use Your LeanIX Workspace
Click 'More' in the main navigation, then select 'Extension Hub'.
You will be signed in automatically.

Change Log
No version history available.
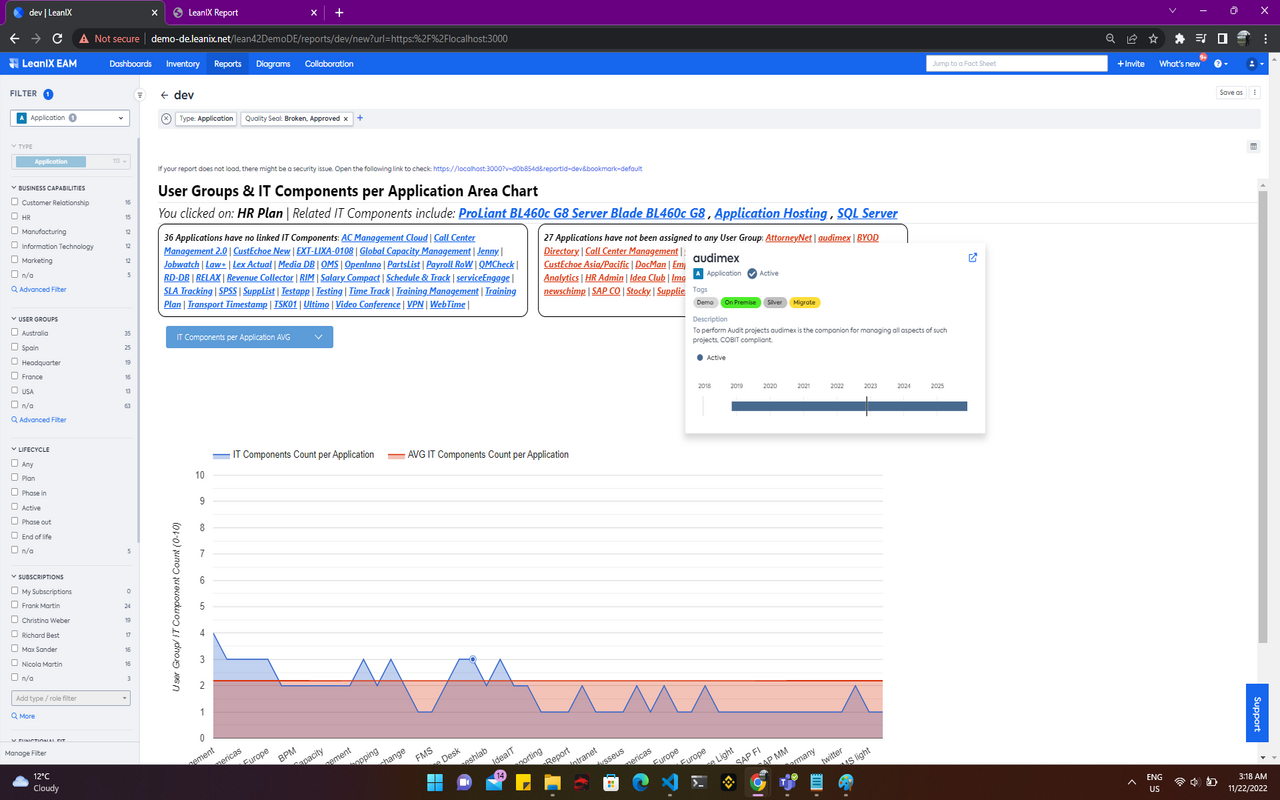
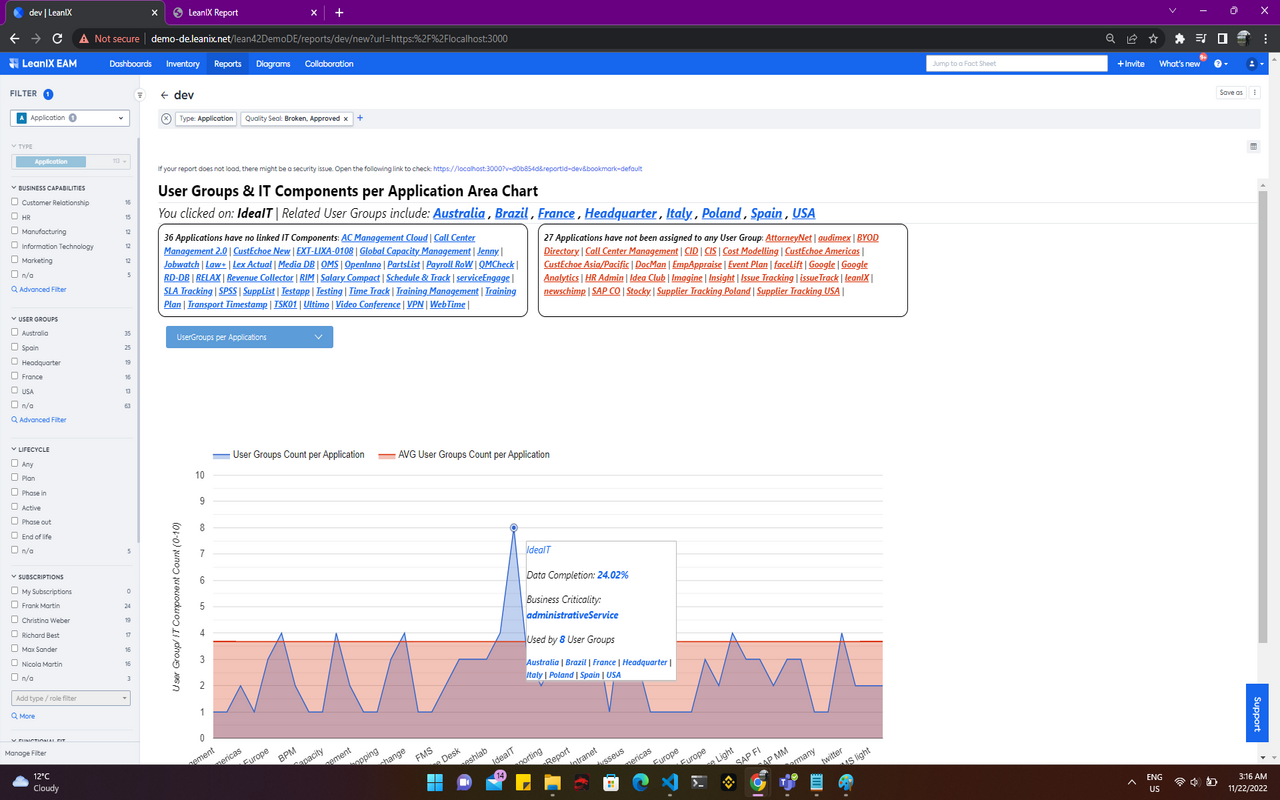
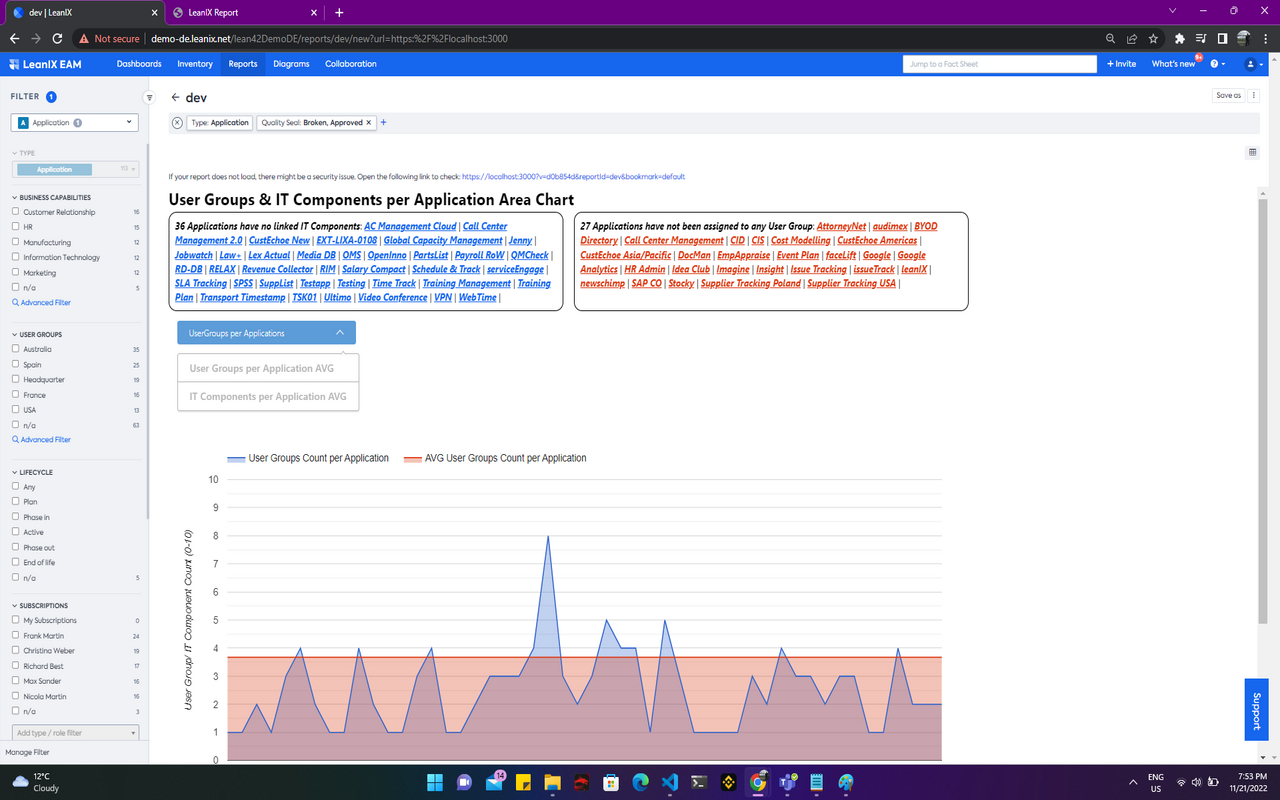
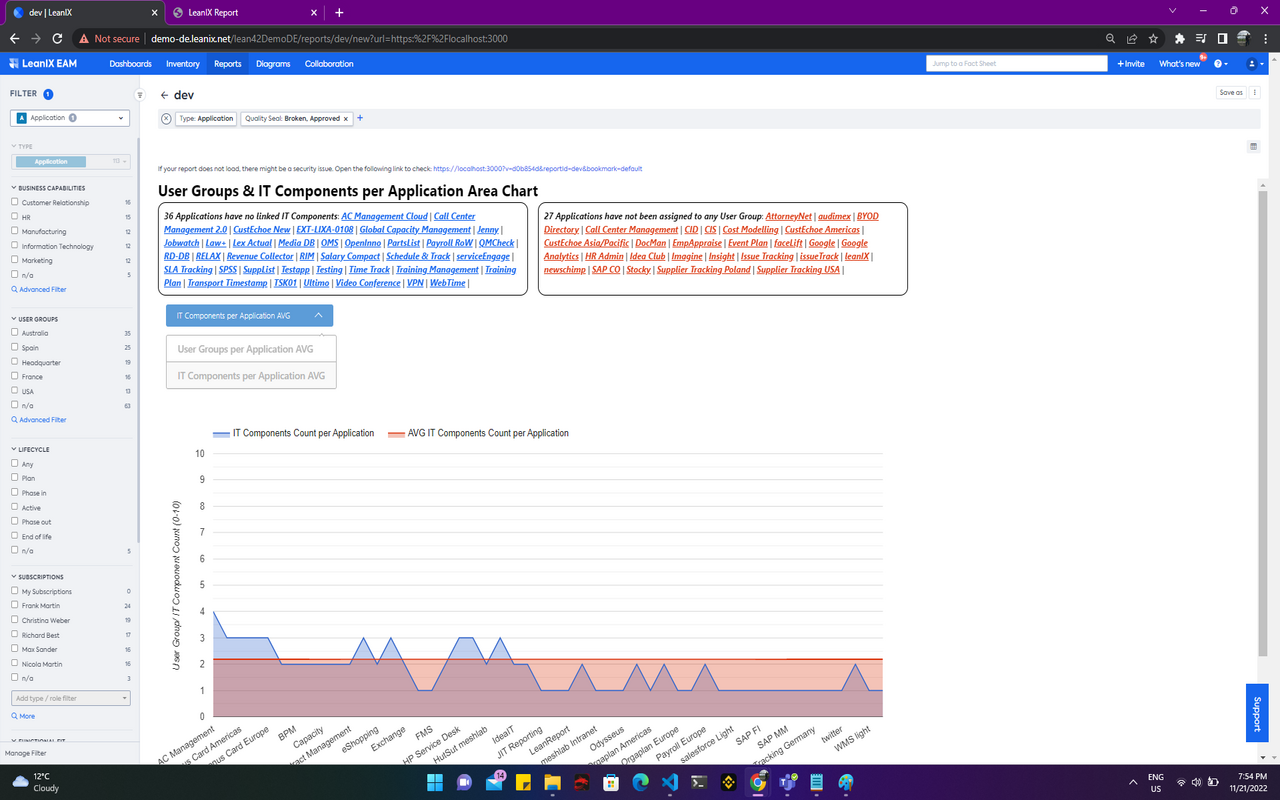
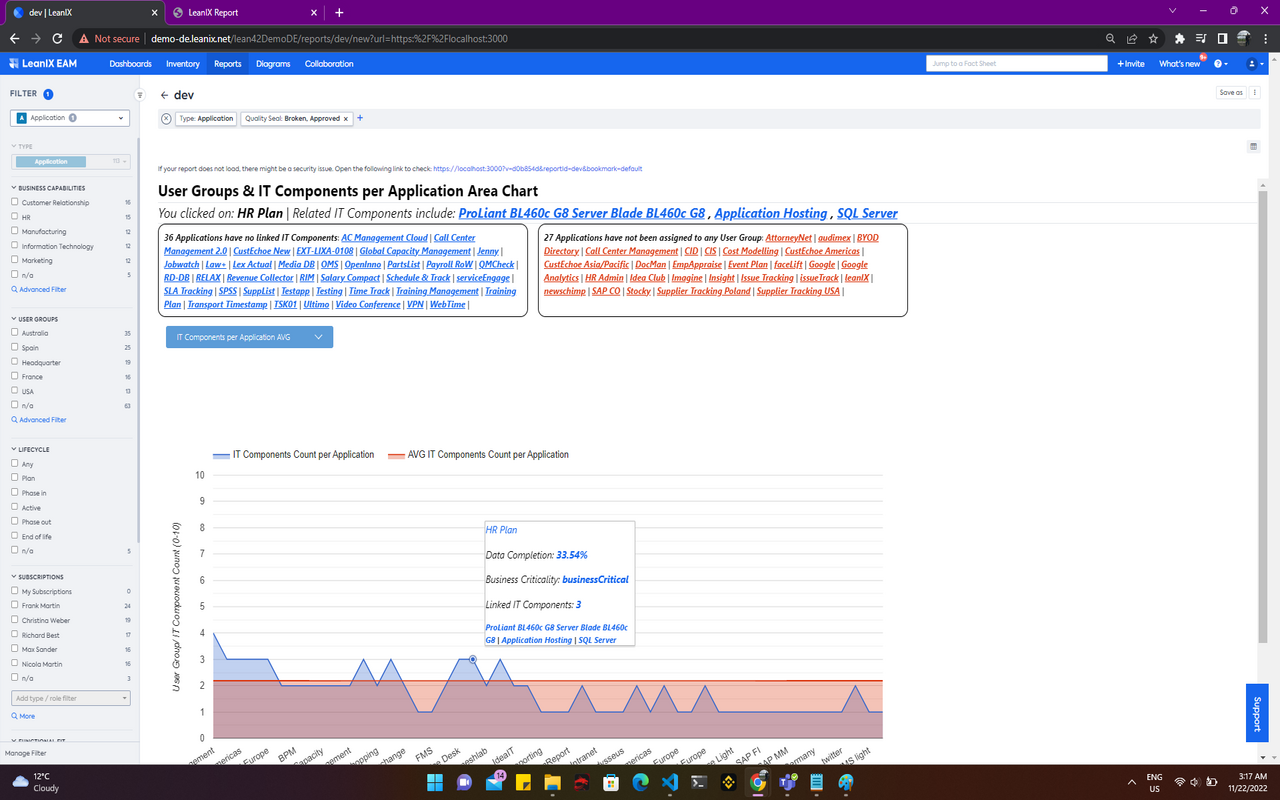
This Area Chart is plotting counts of User Groups and IT Components per Application (using Google Chart).
For applications you can choose two different values, e.g. the count of associated User Groups vs. the average count of User Groups across all applications.
So you can easily see which applications support way more (or less) business areas than on average.
The chart makes use of tooltips and on click you can see more Application data and drill through to more information.
Details
The report is configured automatically and you can use all standard filters for Applications.
Hover on each dot (on plot) to see more application data in a tooltip. Clicking on a dot displays a section above the chart which can redirect the user to a respective fact sheet. The dropdown select above the chart allows choosing between two distinctive variations of the chart (one using UserGroup Counts and another using IT Component Counts and their averages).
No configured data fields are required for the report to work. No specific tags are required as well. User Groups and IT Components related to Applications is required for the creation of this report.
The report does not make use of any mutations.