Application Integration Graph
Add to
Sign In
Use Your LeanIX Workspace
Click 'More' in the main navigation, then select 'Extension Hub'.
You will be signed in automatically.

Change Log
No version history available.
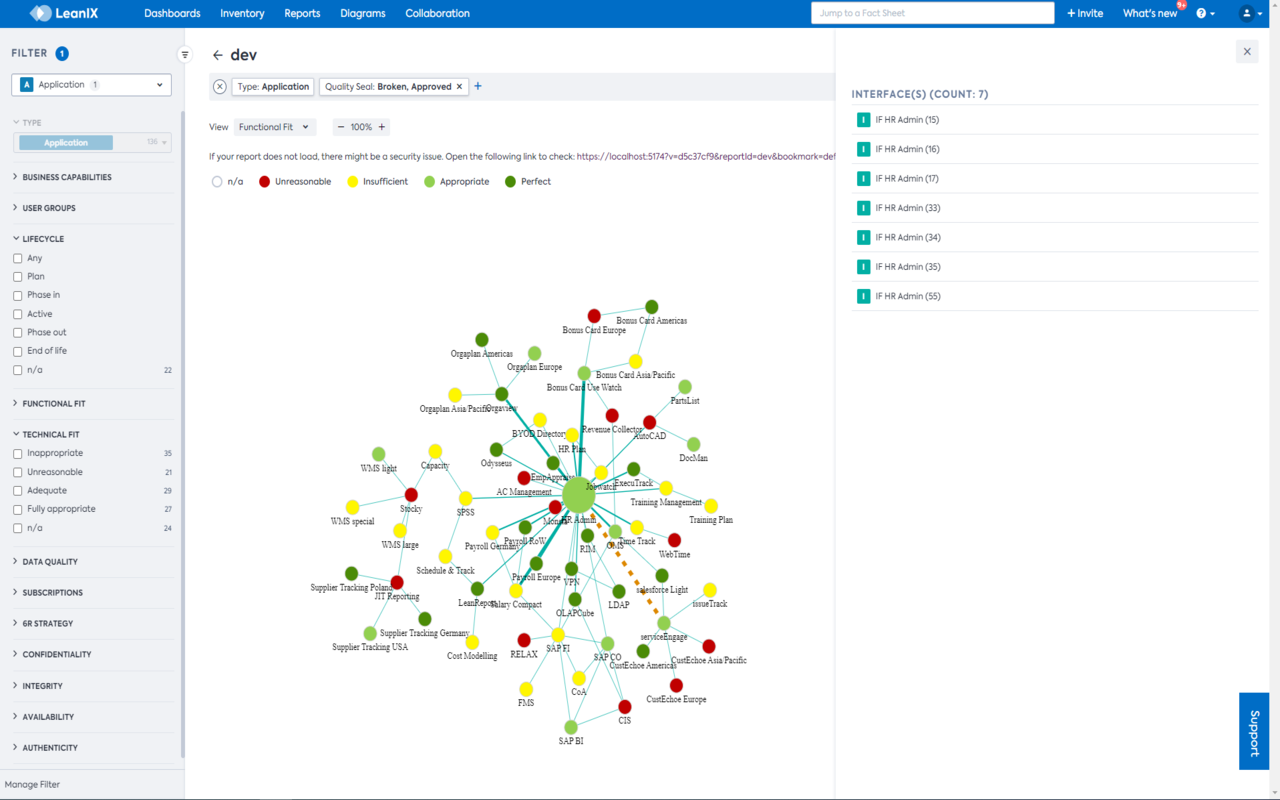
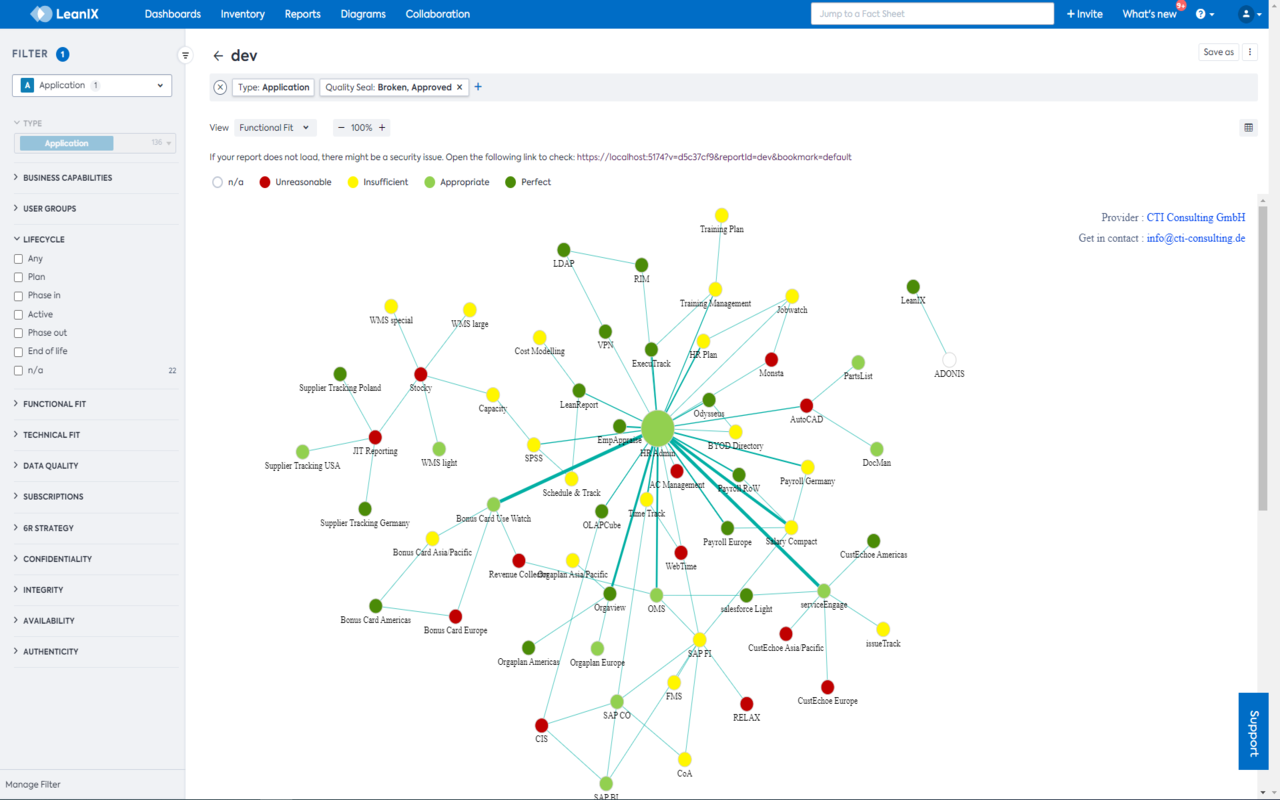
This report is purchasable. If you would like to see a presentation, please contact us (see provider contact information). The custom report “Application Integration Graph” allows you to visualize application clusters and interfaces between applications quickly. The applications (represented via bubbles) are connected via interfaces (represented through lines) to other applications. The application bubbles are increasing in size depending on the amount of interfaces that are provided or consumed.
Details
Contact us to add this Network Graph to your Workspace and now easily get an overview about complexity clusters regarding interfaces between applications.
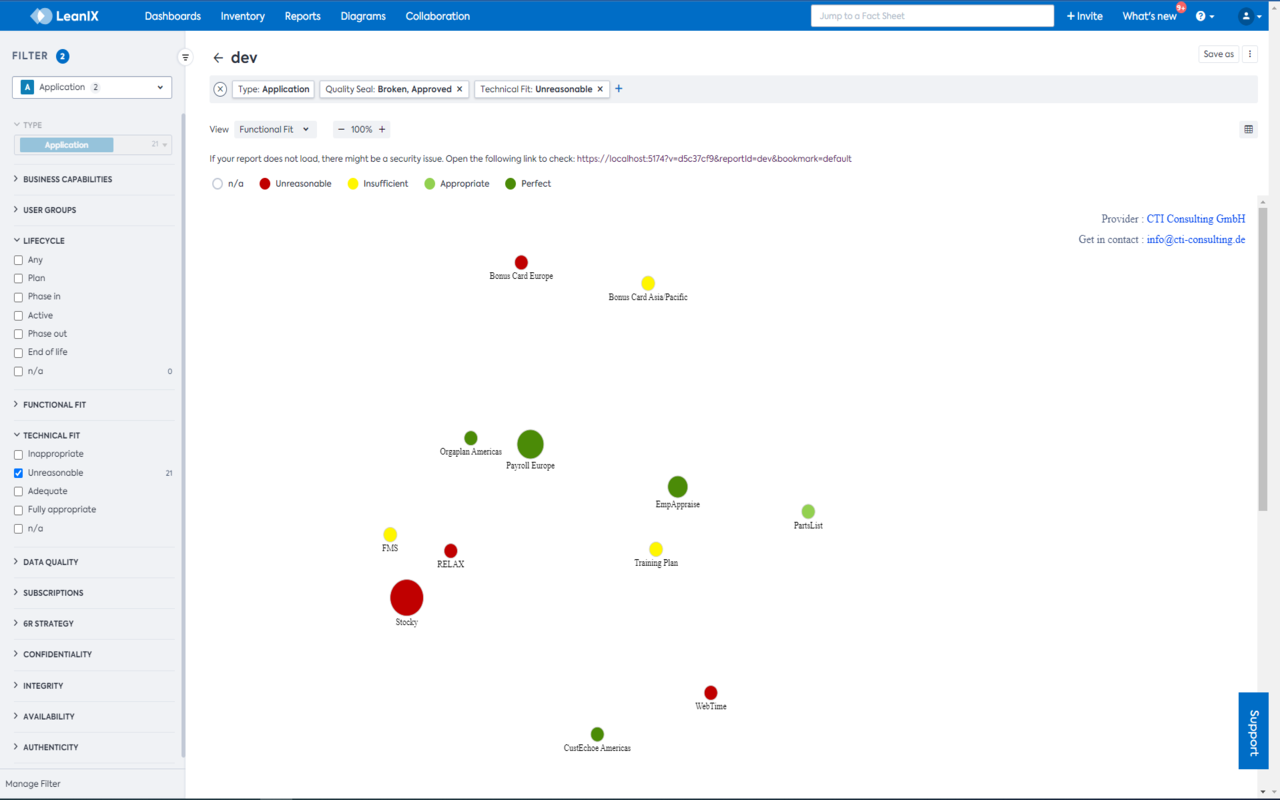
You can filter the report to only show the applications and interfaces for your Use Case and can obtain a color-coding for the applications based on the selected View.
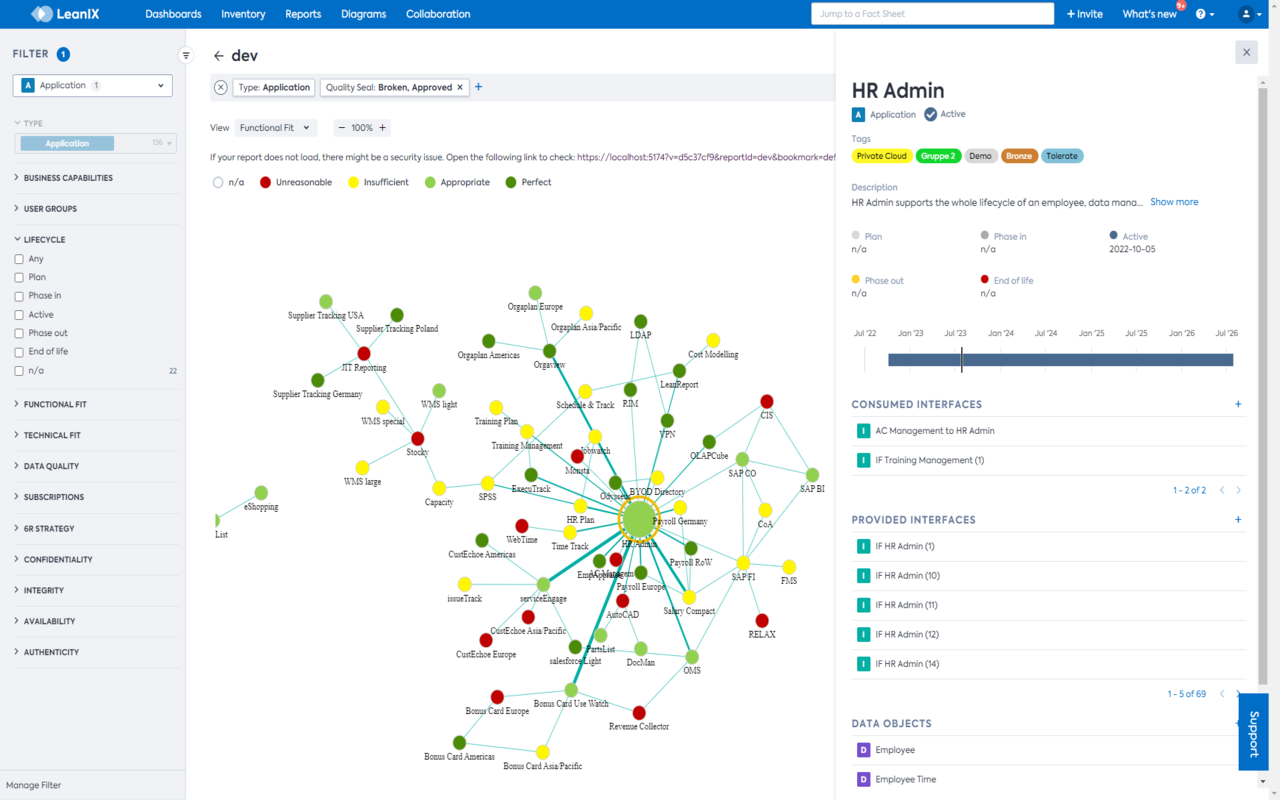
By clicking on an application, a popout with more information about the lifecycle, interfaces and data objects will appear. A click on the interface line will show all the interfaces between two applications.
Once you click on one of the application bubbles, a Pop-Out will appear with more information about the application:
- Tags
- Description
- Lifecycle
- Consumed Interfaces
- Provided Interfaces
- Data Objects
- Once you click on one of the interface lines, a Pop-Out will appear and show all interfaces between two applications.
Needed Data:
- Applications
- Interfaces (including Provider & Consumer Application)
Disclaimer
This extension is offered by CTI Consulting GmbH as-is. CTI Consulting GmbH cannot be held liable or responsible for any data corruption or loss that may occur as a result of using this extension. Additionally, the use of this extension does not impose any liability on CTI Consulting GmbH, except for what is outlined in the LeanIX Store General T&Cs for Content Providers or other agreements with CTI Consulting GmbH.