Bar Chart: IT Components per Application
Add to
Sign In
Use Your LeanIX Workspace
Click 'More' in the main navigation, then select 'Extension Hub'.
You will be signed in automatically.

Change Log
No version history available.
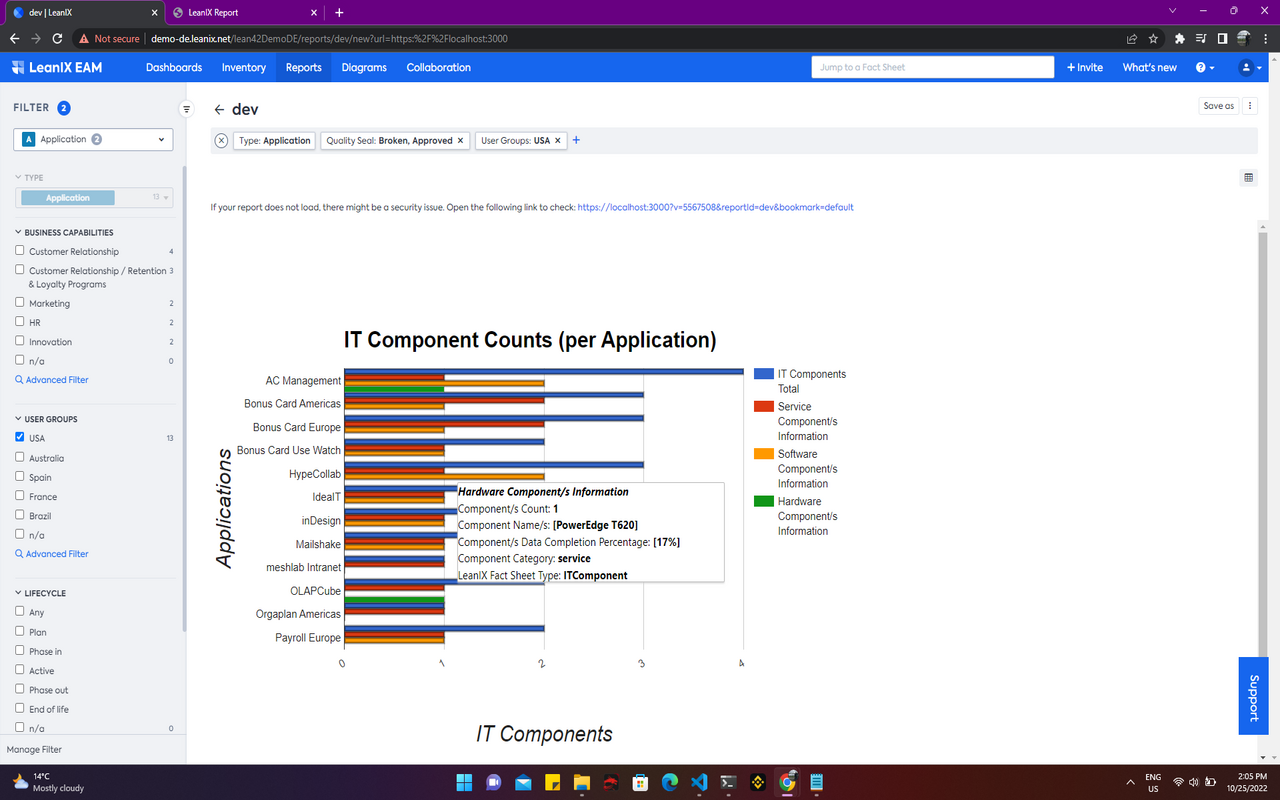
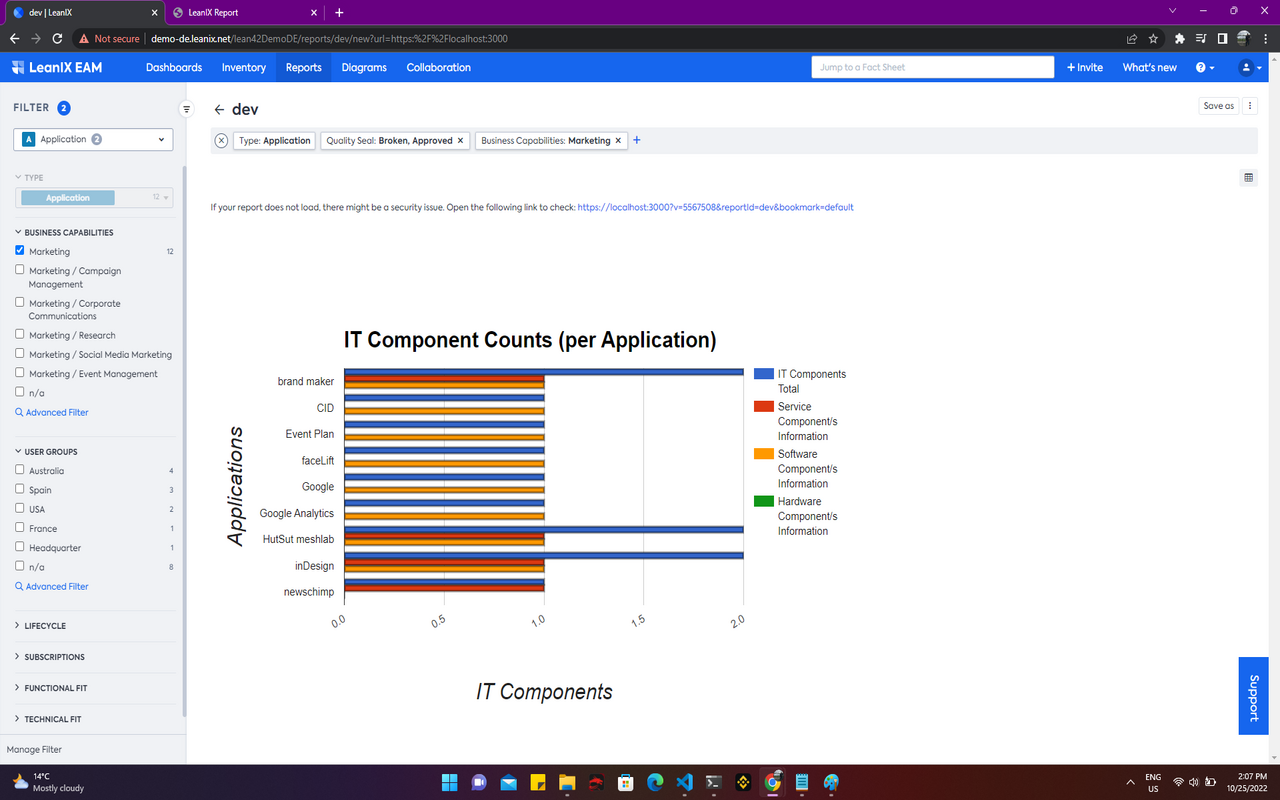
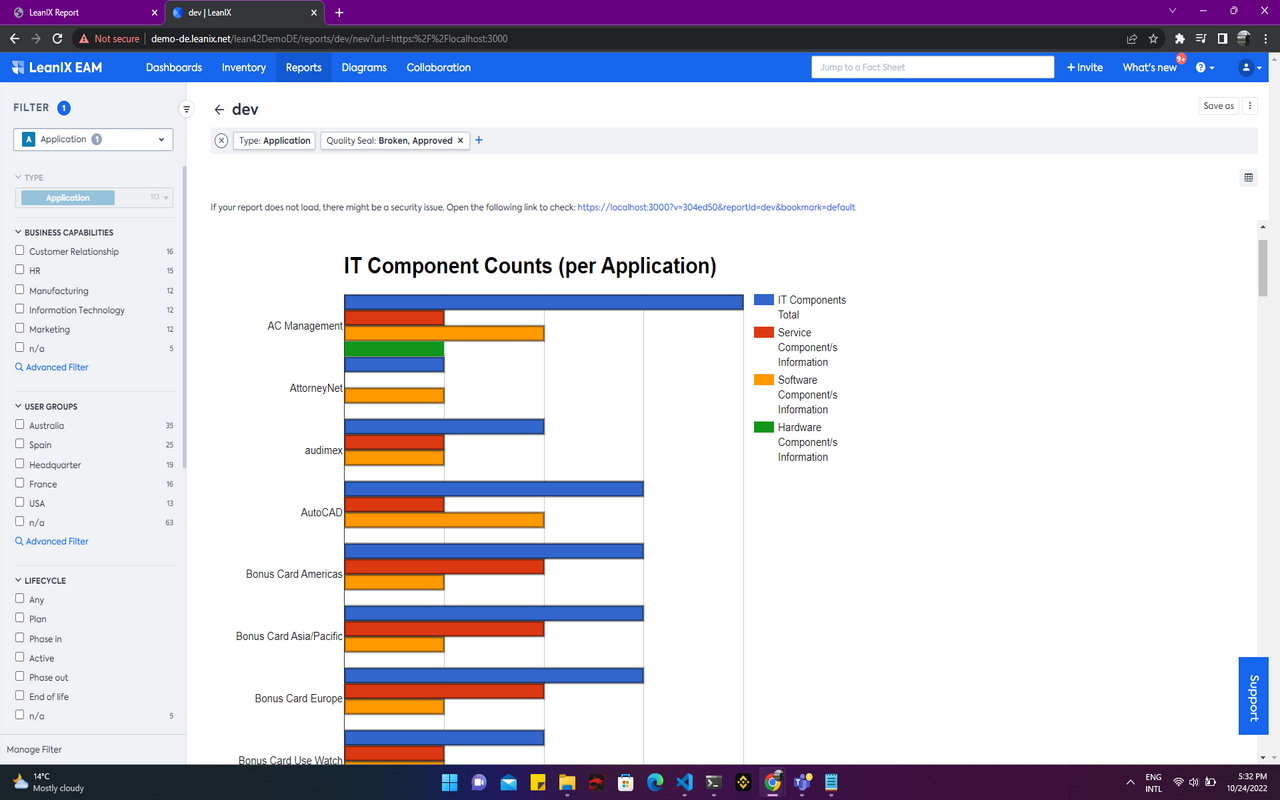
This BarChart (using Google Charts) shows the amount and type/s of IT Components assigned to an Application. Each bar shows the number of IT Components per category - using the categories of IT Components (e.g. Service, Software, Hardware), plus additionally the blue bar shows total count of IT Components related to an Application.
Details
The report is configured automatically and supports all fact sheet type filter for Applications.
Configured data fields and specific tags are not required by this report.
The Fact Sheets Applications and their related IT Components (with a categroy) are required for this report.
The report does not make use of any mutations.