Obsolescence risk report (system view)
Add to
Sign In
Use Your LeanIX Workspace
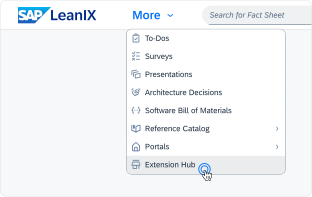
Click 'More' in the main navigation, then select 'Extension Hub'.
You will be signed in automatically.
Change Log
No version history available.
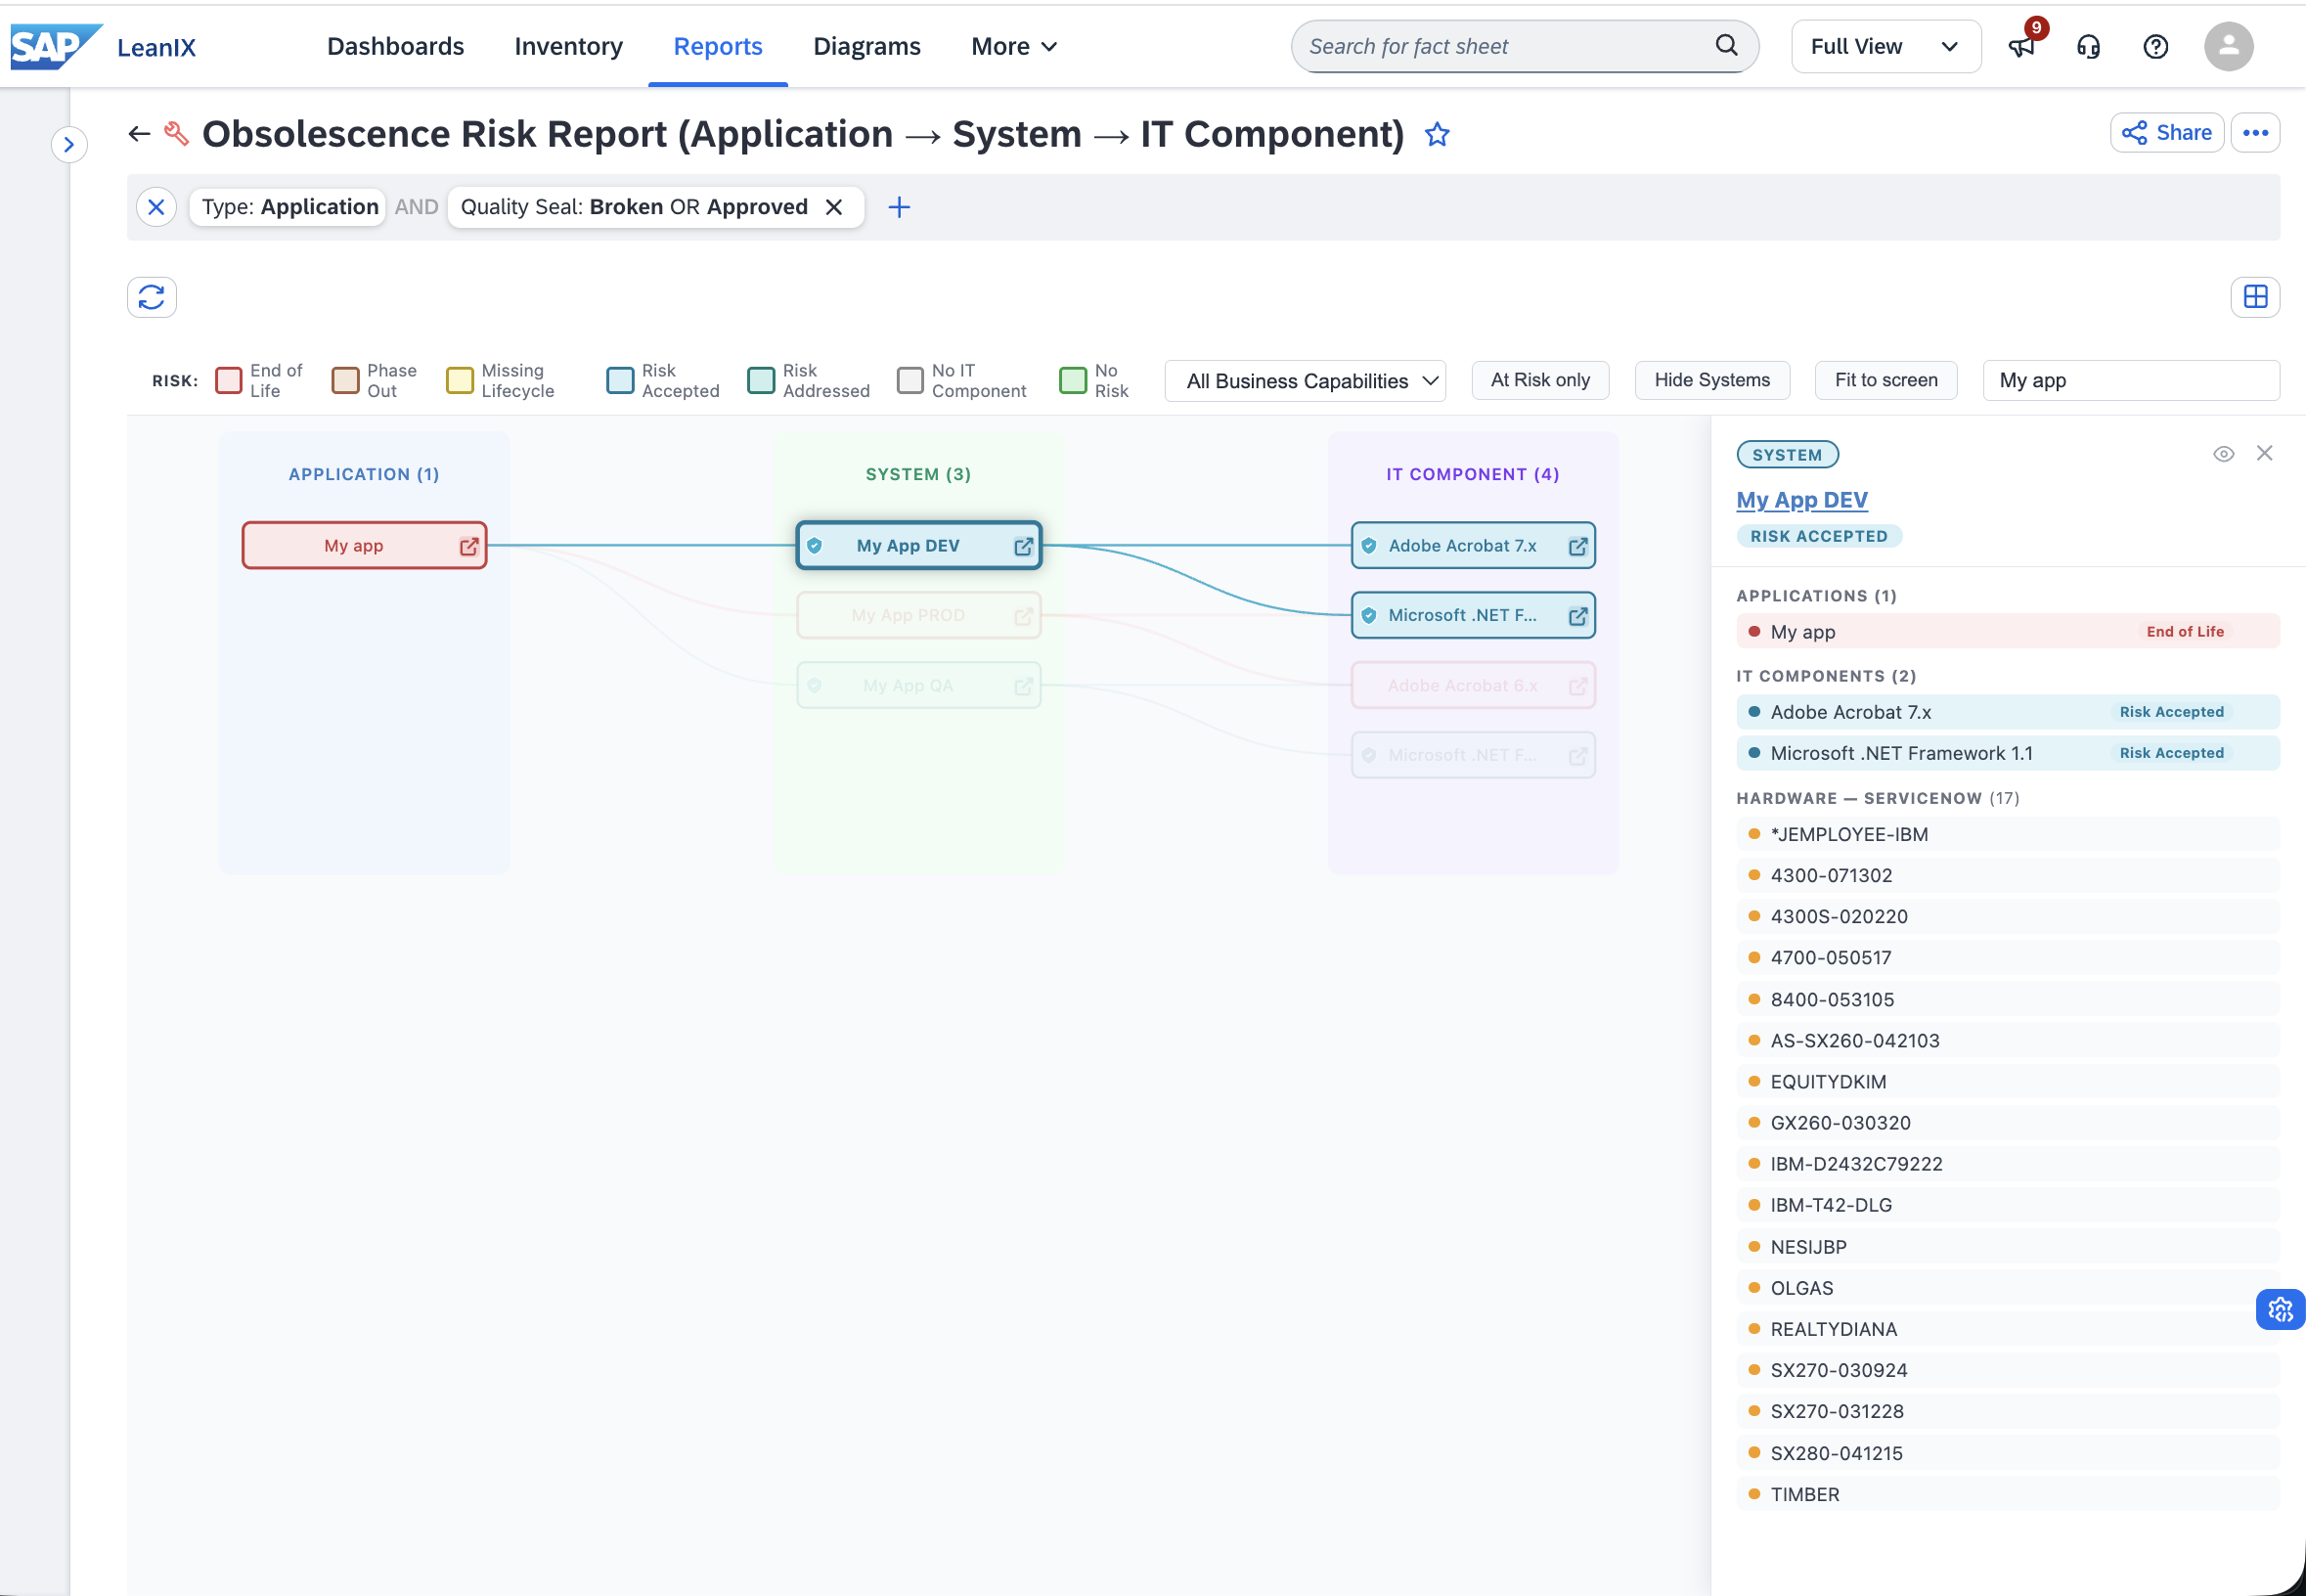
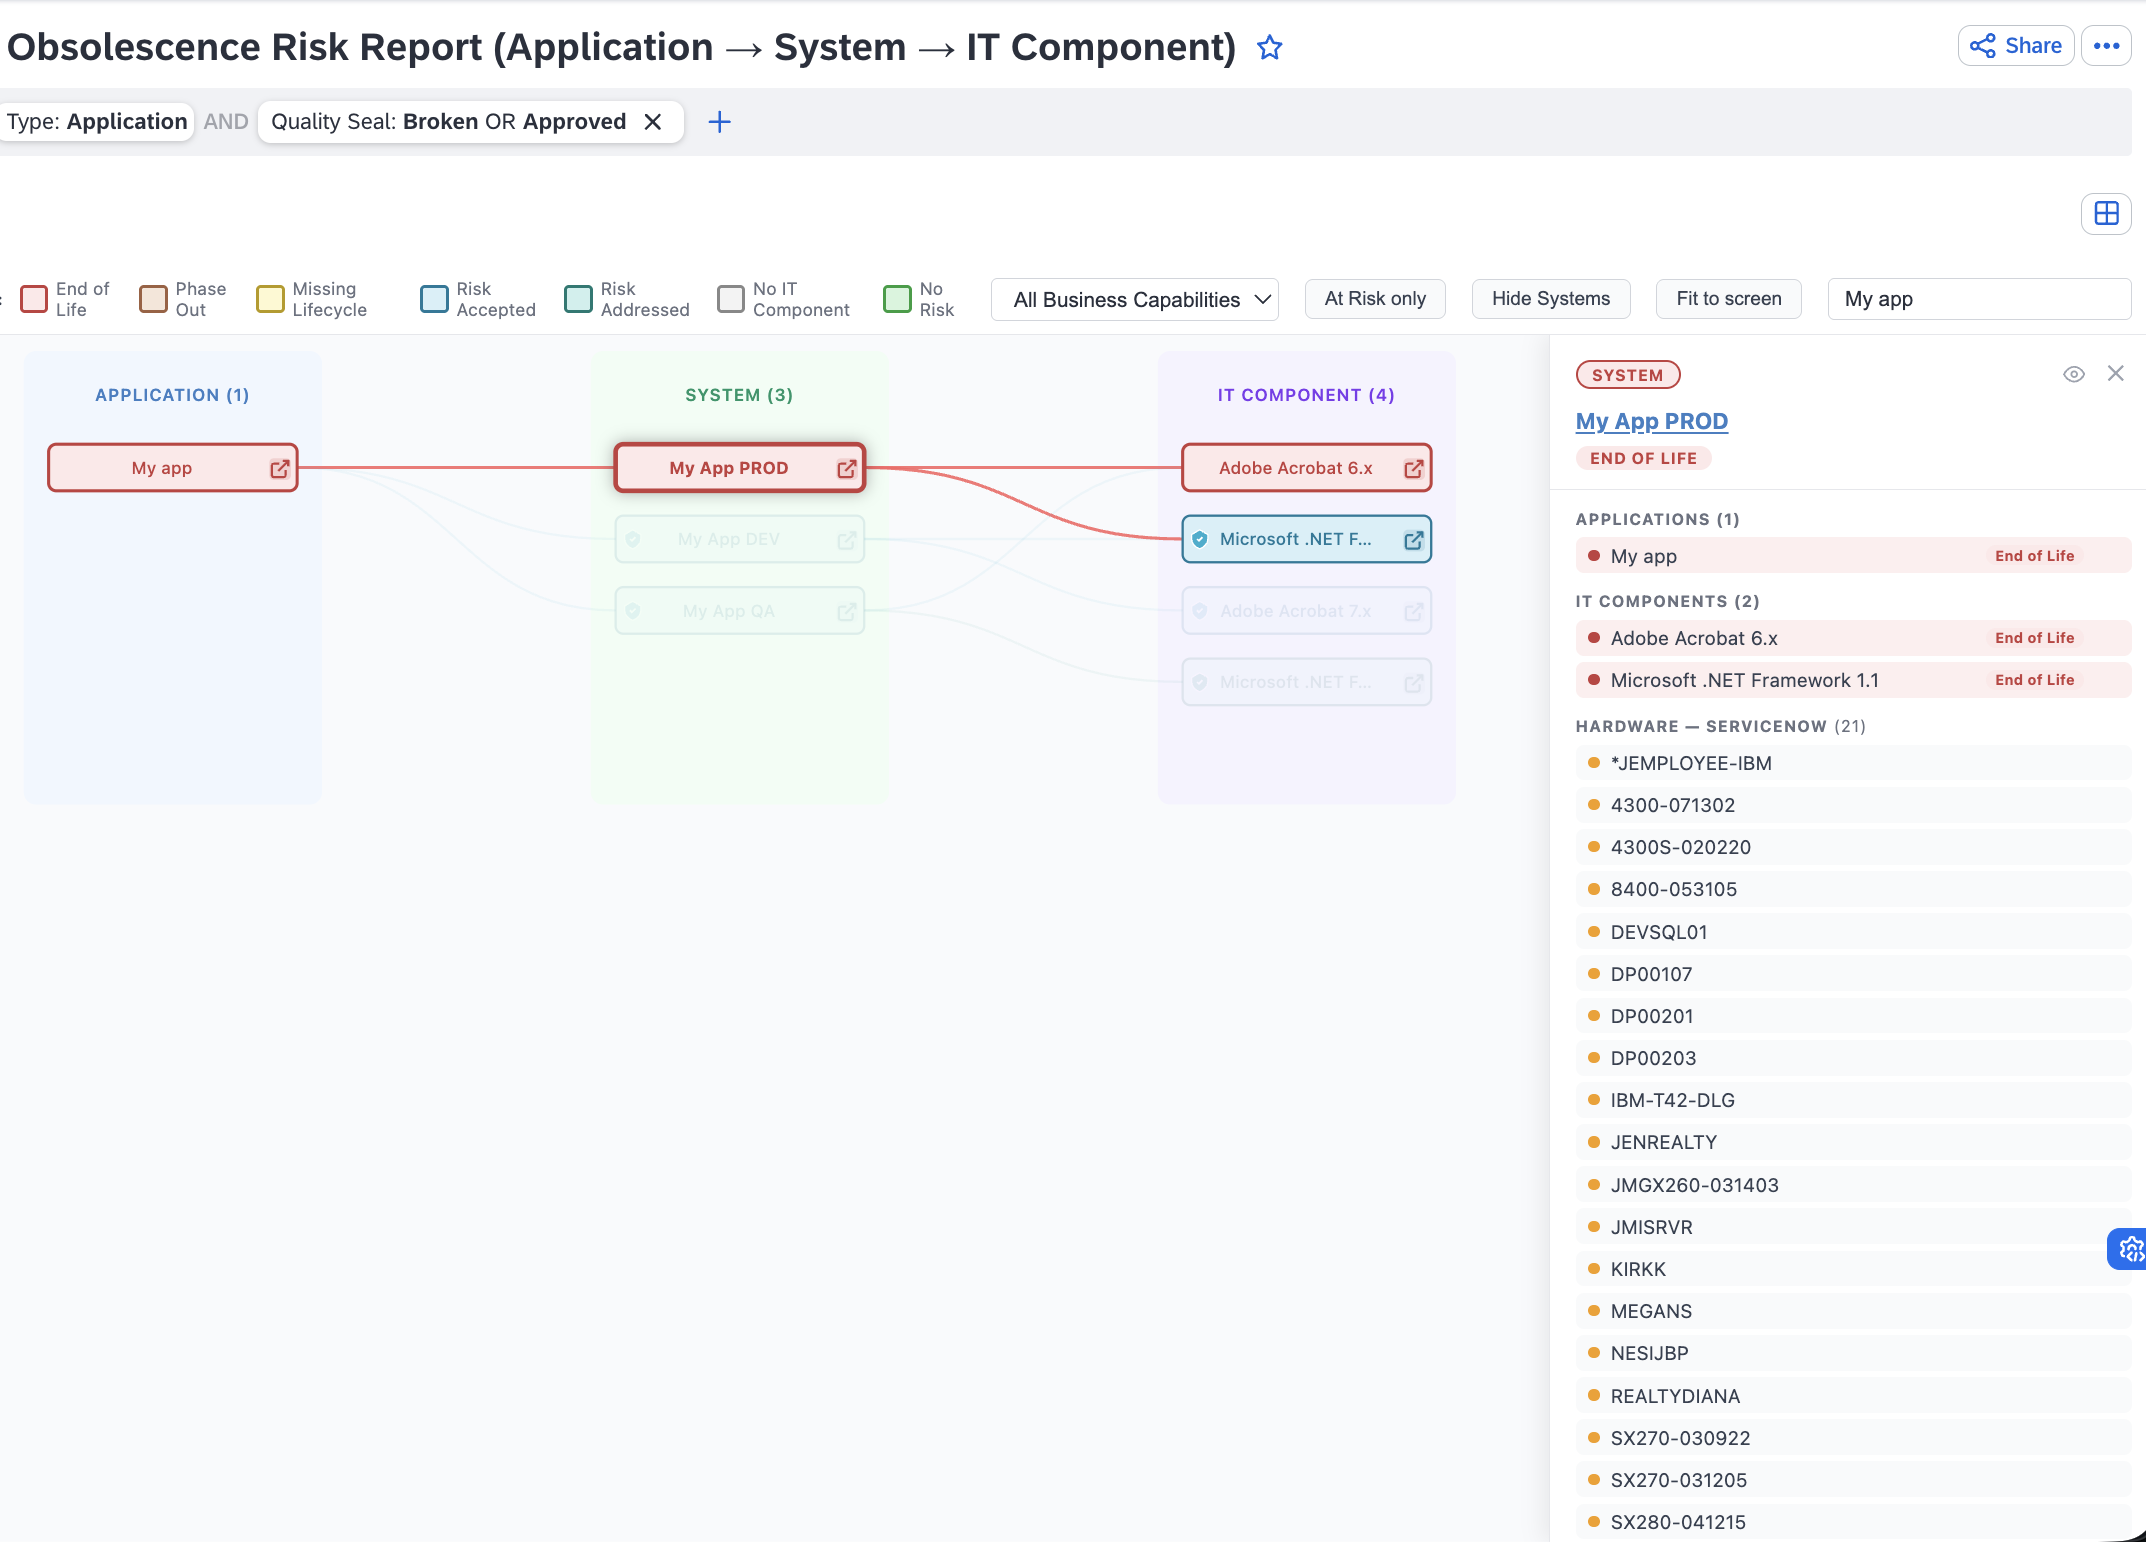
This report gives you an instant view of your software obsolescence risk by mapping the full chain from Applications through Systems down to the IT Components running beneath them.
It support the new metamodel extension automatically identifies the obsolescence risk on the systema level and highlights the affected applications. With his pragmatic approach, this report points you exactly to the hardware in ServiceNow where that software is installed on. So you can assess the real-world impact and prioritise remediation with confidence.
Details
This report fetches all Applications, Systems, and software IT Components from your LeanIX workspace and arranges them in a three-column graph. Each column represents one level of the chain: Applications on the left, Systems in the middle, and IT Components on the right. This element are linked with curved lines showing the relationships between them.
Fact sheets are colour-coded by risk:
- red indicates an IT Component in End of Life or Phase Out
- green indicates no risk.
At-risk items are always sorted to the top of each column so the most critical items are immediately visible.
You can zoom and pan the canvas freely to explore the full graph.
Clicking any node opens a detail panel on the right.
- For an IT Component, it shows the lifecycle timeline and the list of hardware CIs from ServiceNow where that software is installed, each with a direct link into the ServiceNow record.
- For an Application and System, it aggregates the hardware across all its underlying software components so you can see the full exposure at a glance. For a System, it shows its parent Applications and child IT Components.
The toolbar offers three ways to narrow the graph:
- filter by Business Capability to focus on a specific area of the business
- toggle At Risk Only to hide all applications with no risk
- type directly in the search box to find a specific fact sheet by name.
- a fit to screen function allows user to resize the Diagram
In order to use the full capability of this report, you must:
- Collect your ITC/Software fact sheets using the out-of-the-box ServiceNow integration, which enables the Aggregation and Linkage feature.
- Enable the System Fact Sheet extension, which is required for complete functionality. The System Fact Sheet extension can be enabled in one of the following ways:
- Via the Extension hub
- Or from Optional Features and Early Access within your LeanIX workspace.
Disclaimer
This report template is provided as-is for informational and illustrative purposes. It is not an official SAP or LeanIX product and is not covered by any SAP support agreement.
The hardware inventory data displayed in this report is retrieved in real time from your ServiceNow integration via the LeanIX Smart Aggregation (Asset & Lifecycle) service. The accuracy and completeness of this data depends entirely on the configuration and sync status of your ServiceNow integration. The author makes no guarantee that the data shown is complete, current, or free from errors.
This template requires a LeanIX workspace with IT Component lifecycle data populated and an active ServiceNow integration with a completed Asset & Lifecycle sync run. It may not function as intended if these prerequisites are not met.
The ServiceNow deep-links generated by this report point to your configured ServiceNow instance. Access to those links is governed by your organisation's ServiceNow permissions and is outside the scope of this template.
By installing and using this template, you accept that it may need to be adapted to fit your specific workspace configuration, data model, or organisational standards. The author accepts no liability for decisions made on the basis of information displayed by this report.