Inventory Explorer (Sankey View)
Add to
Sign In
Use Your LeanIX Workspace
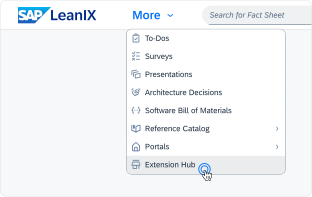
Click 'More' in the main navigation, then select 'Extension Hub'.
You will be signed in automatically.
Change Log
No version history available.
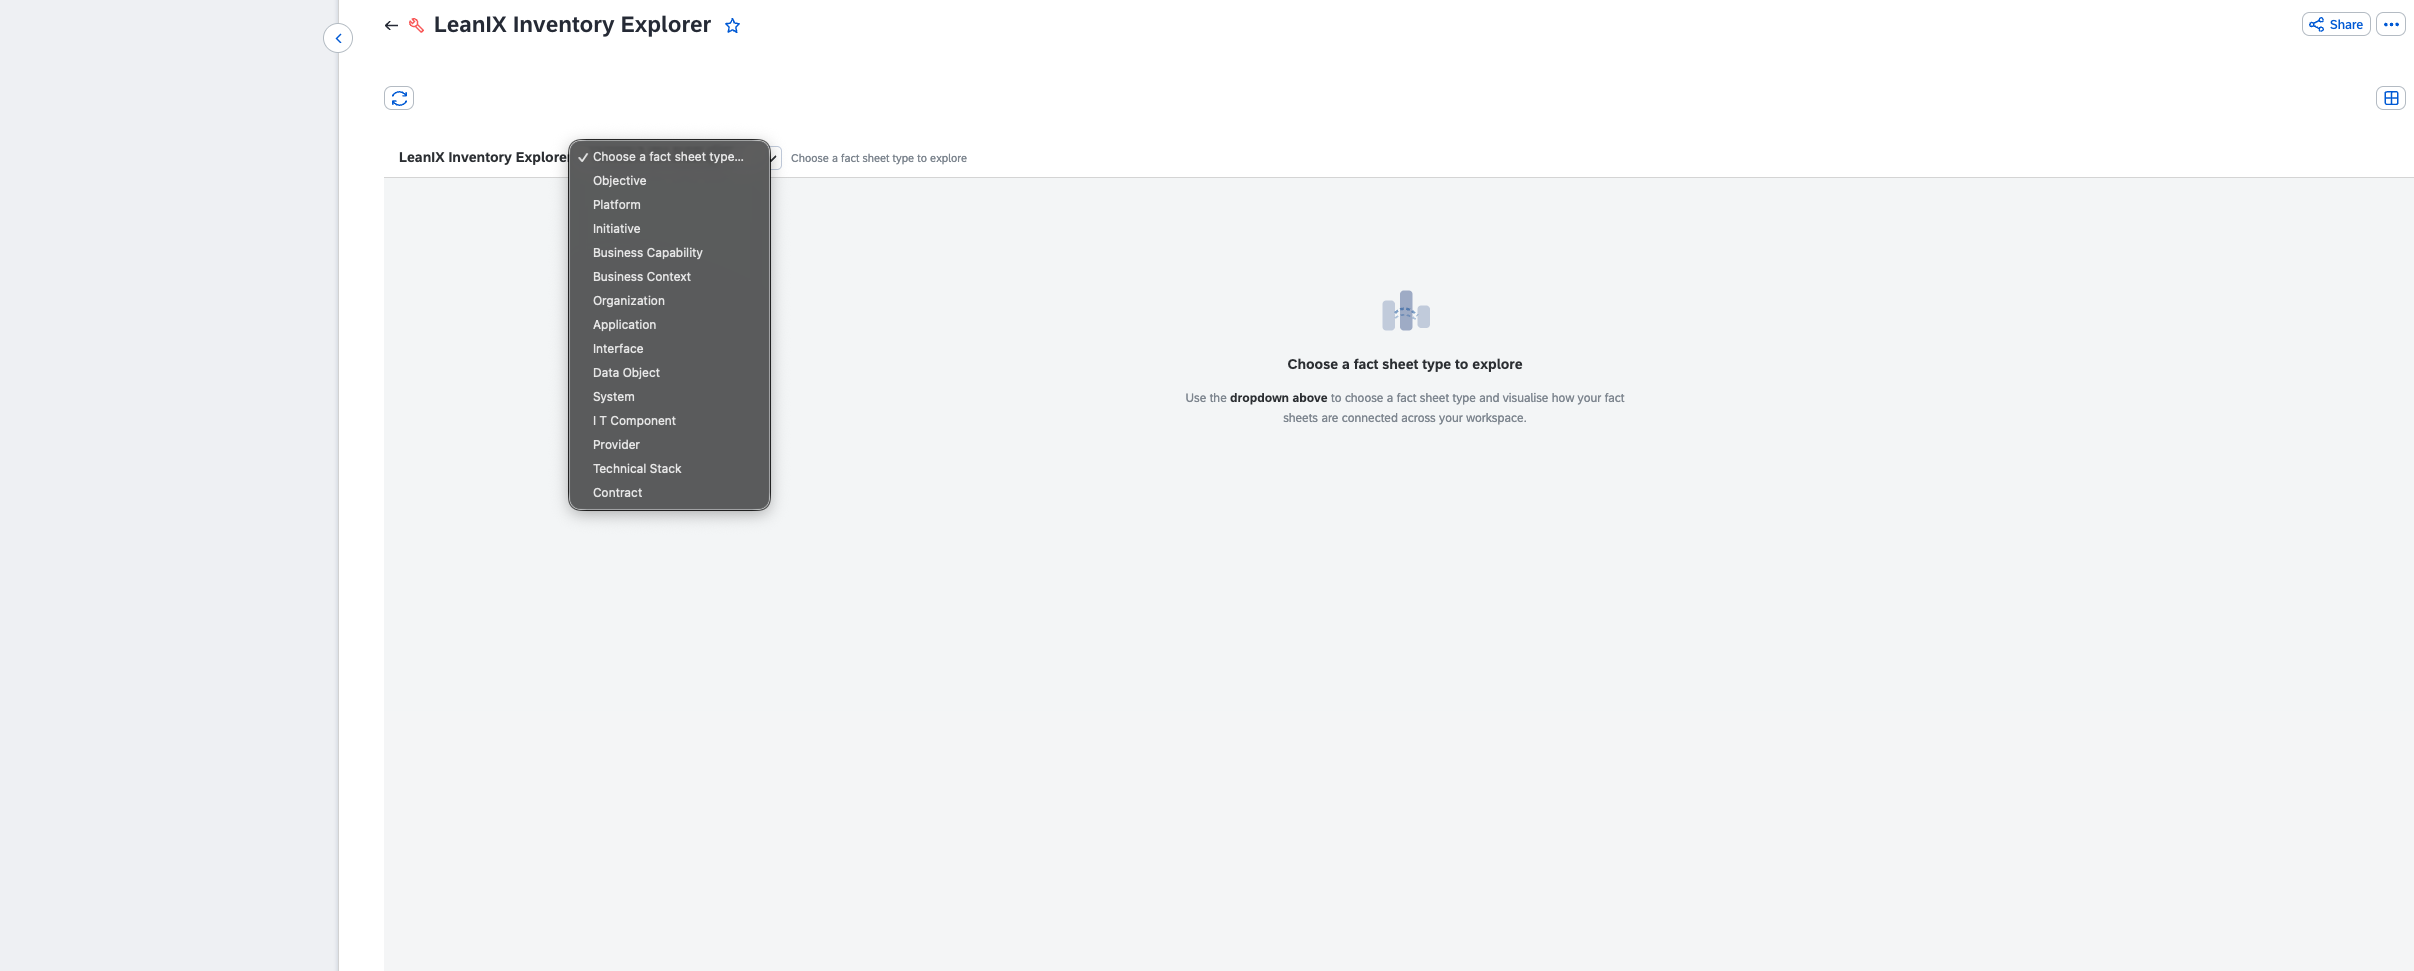
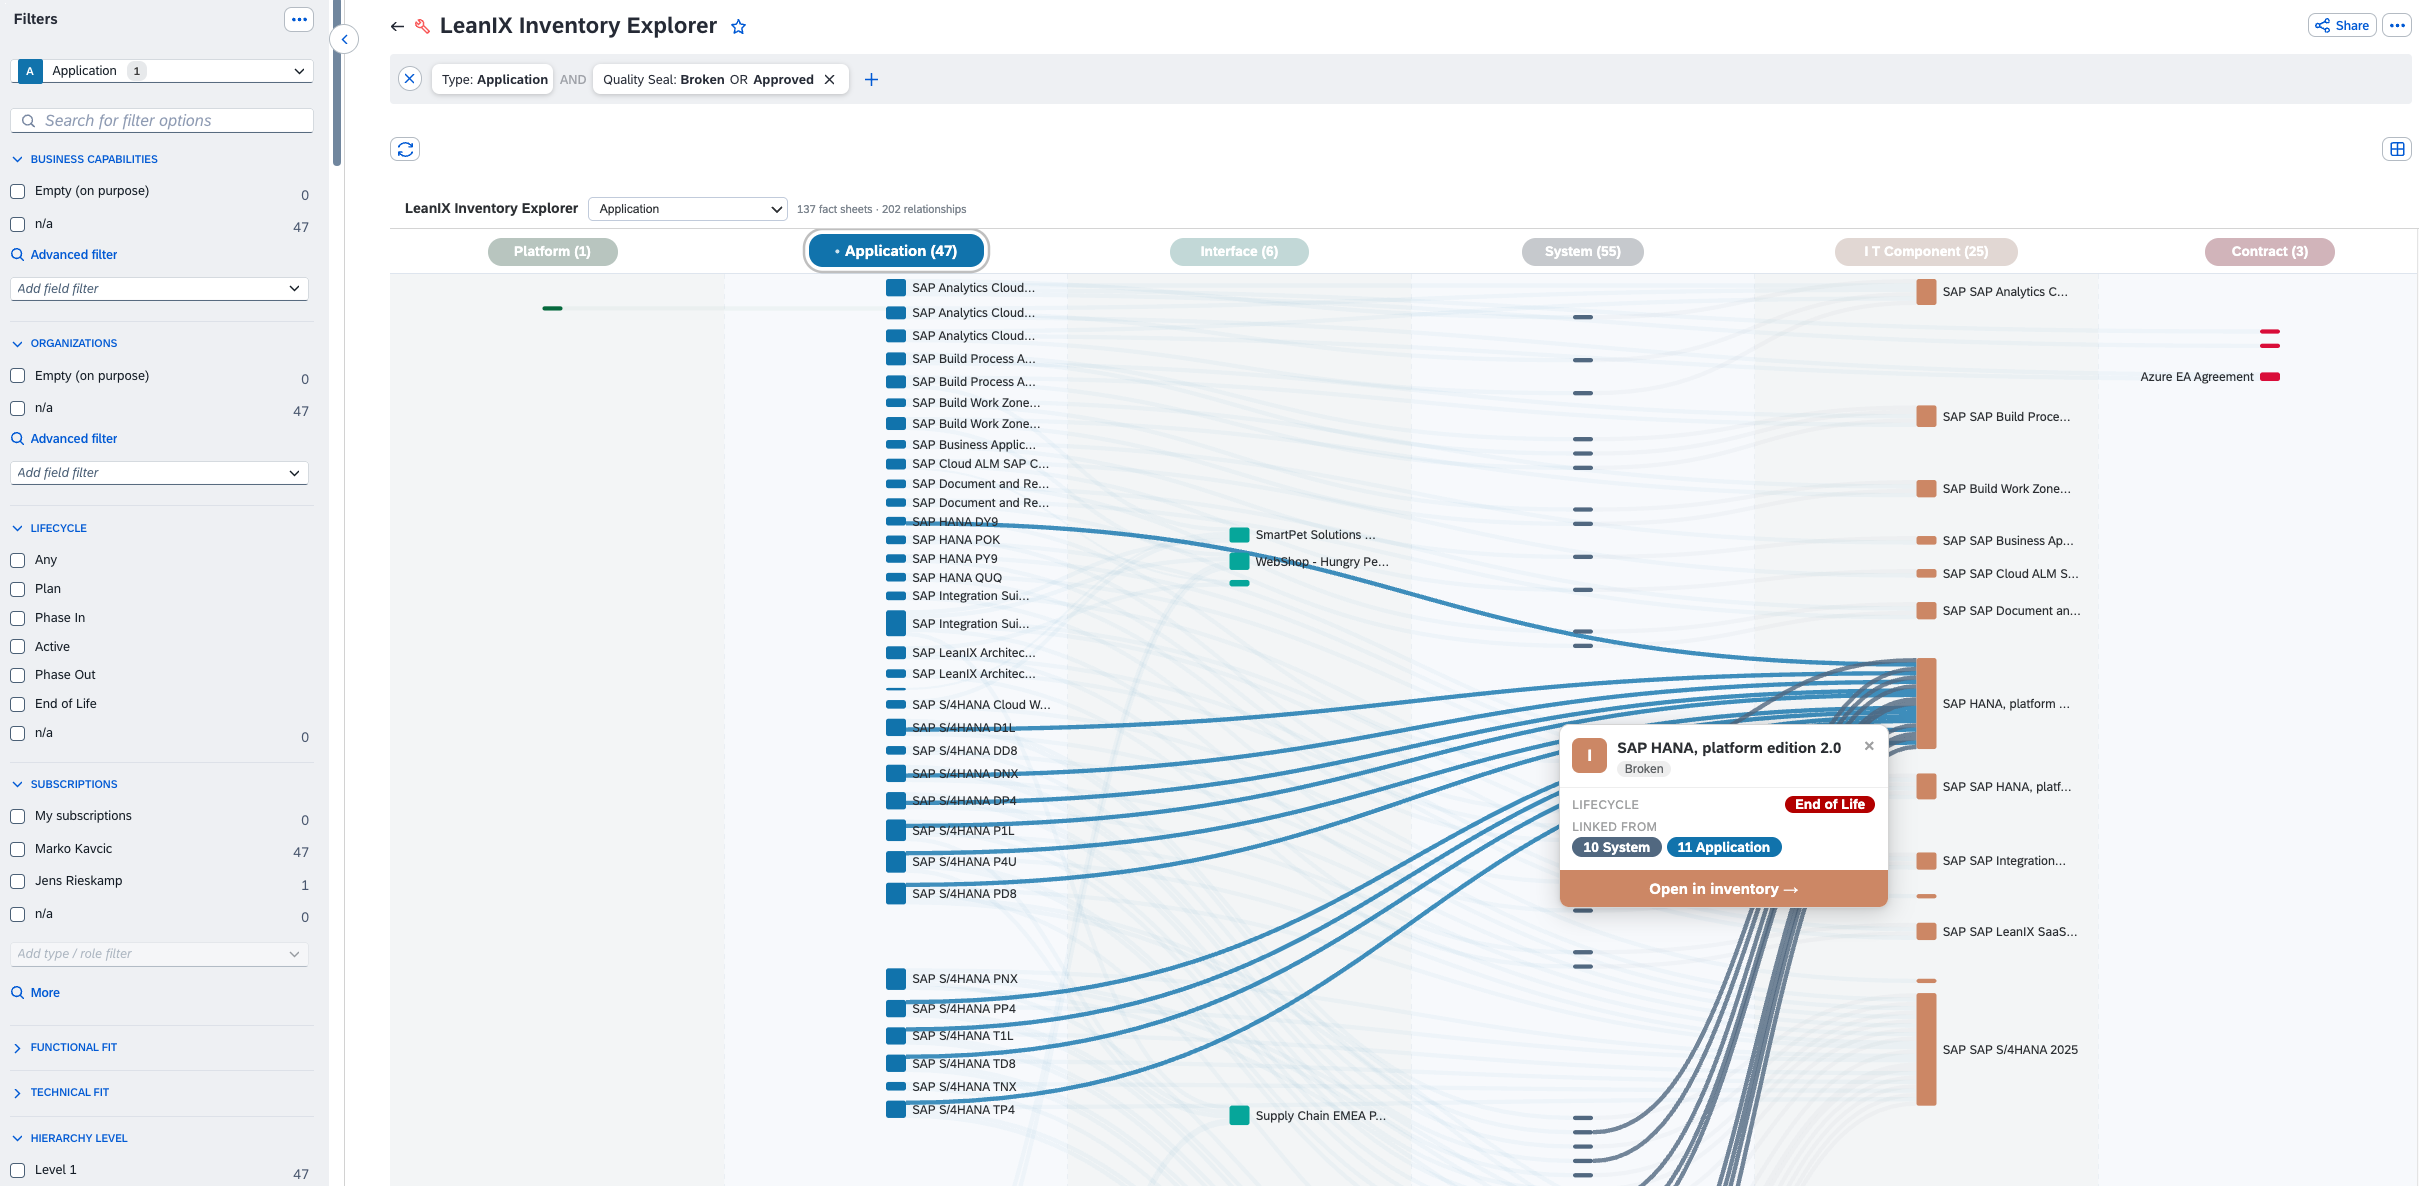
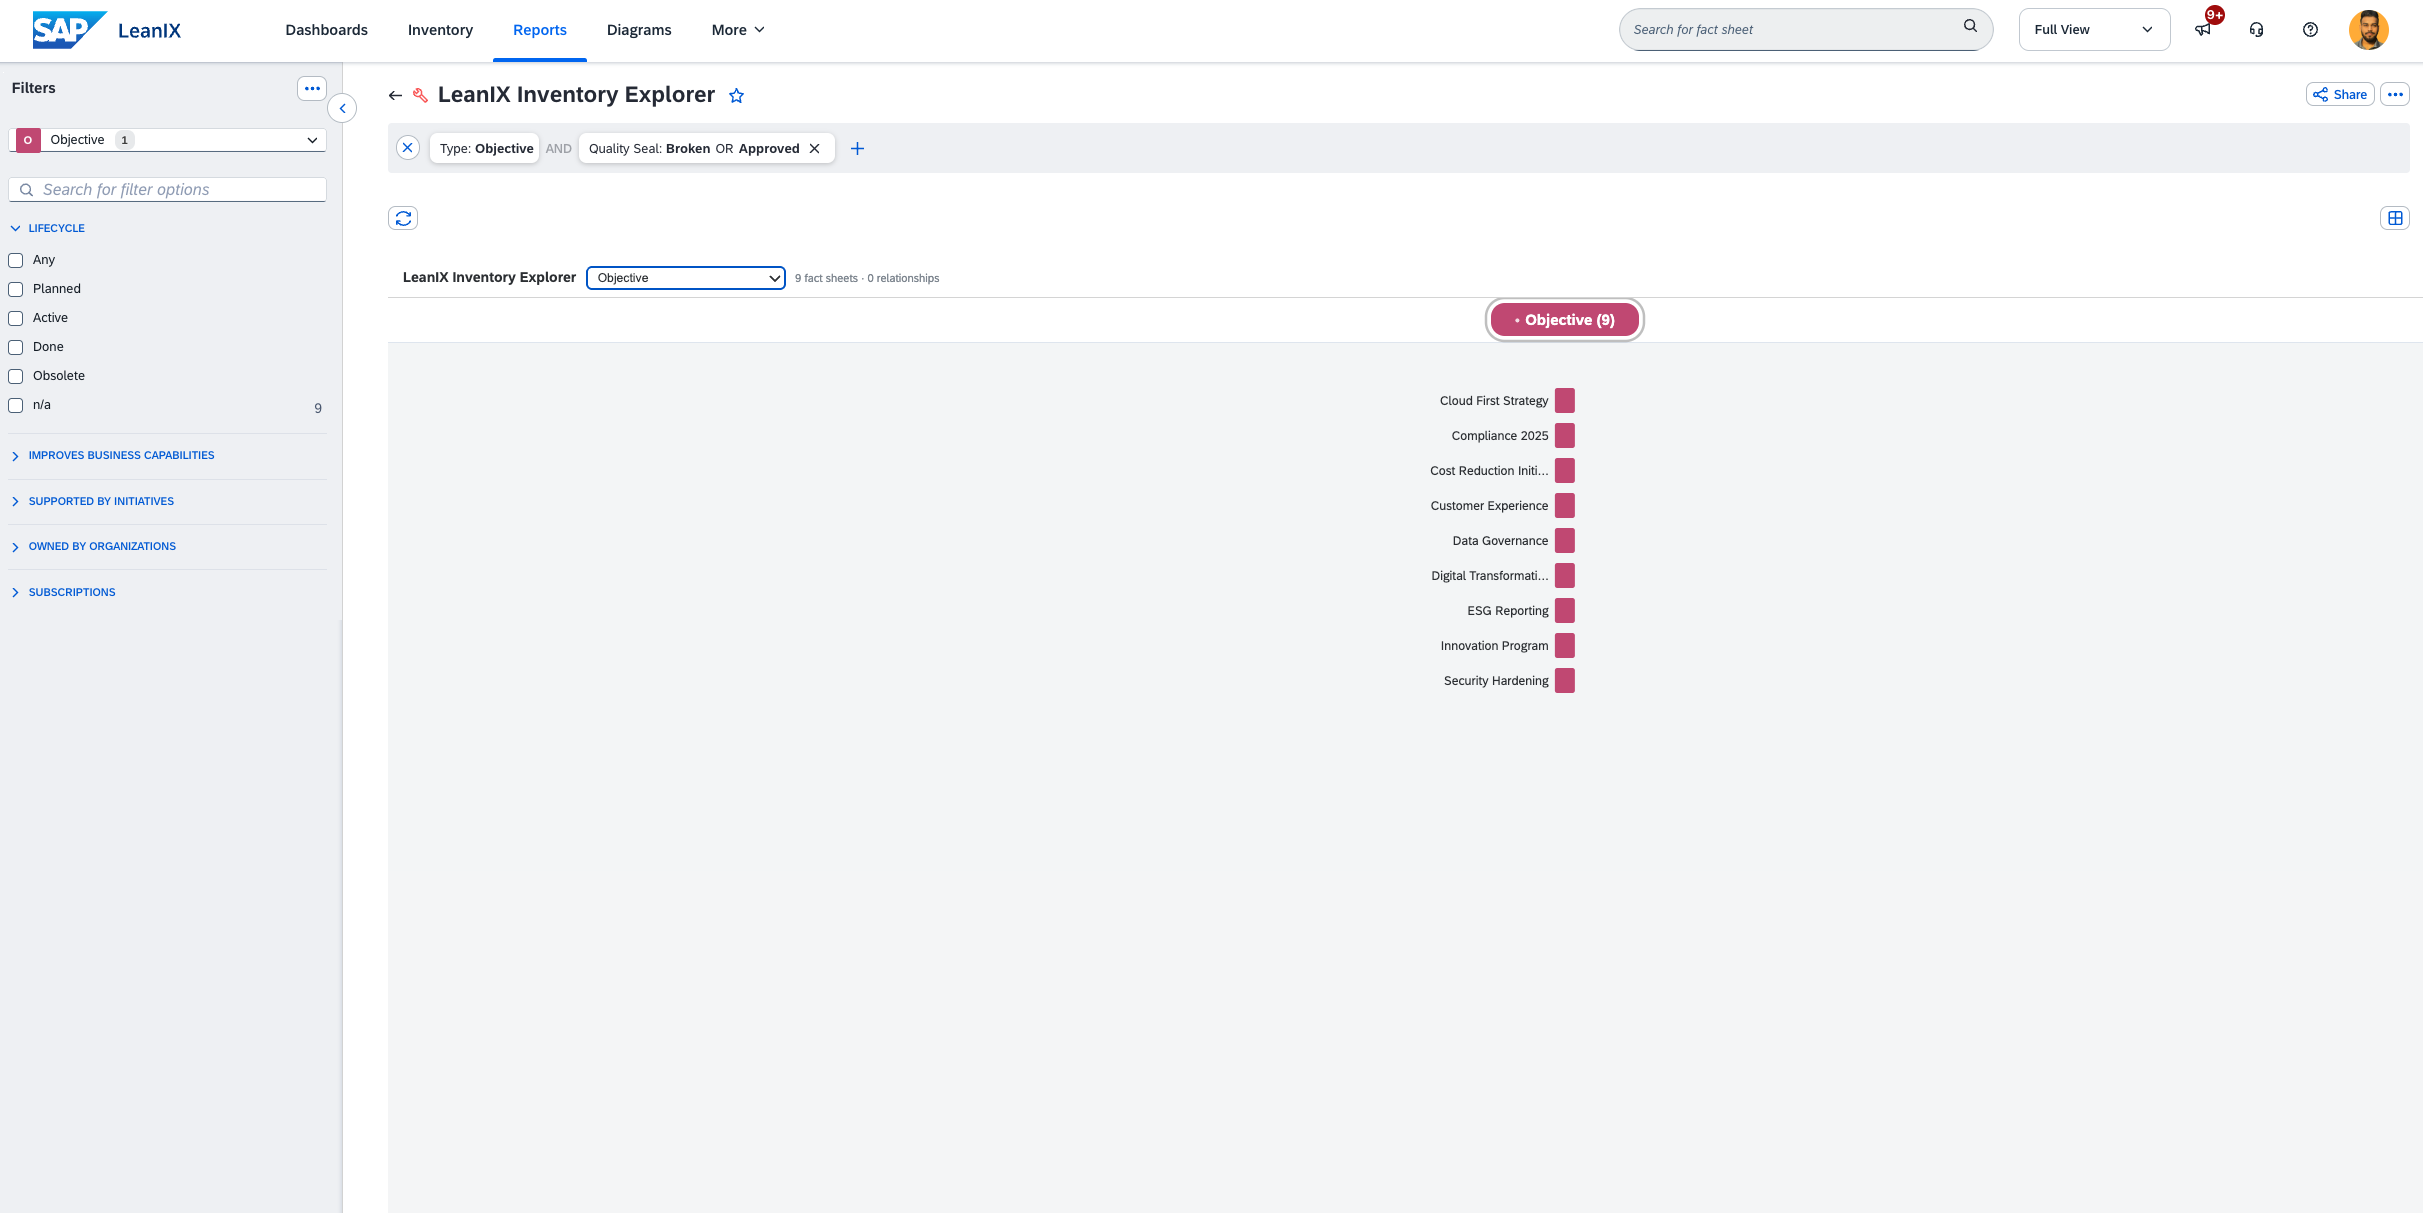
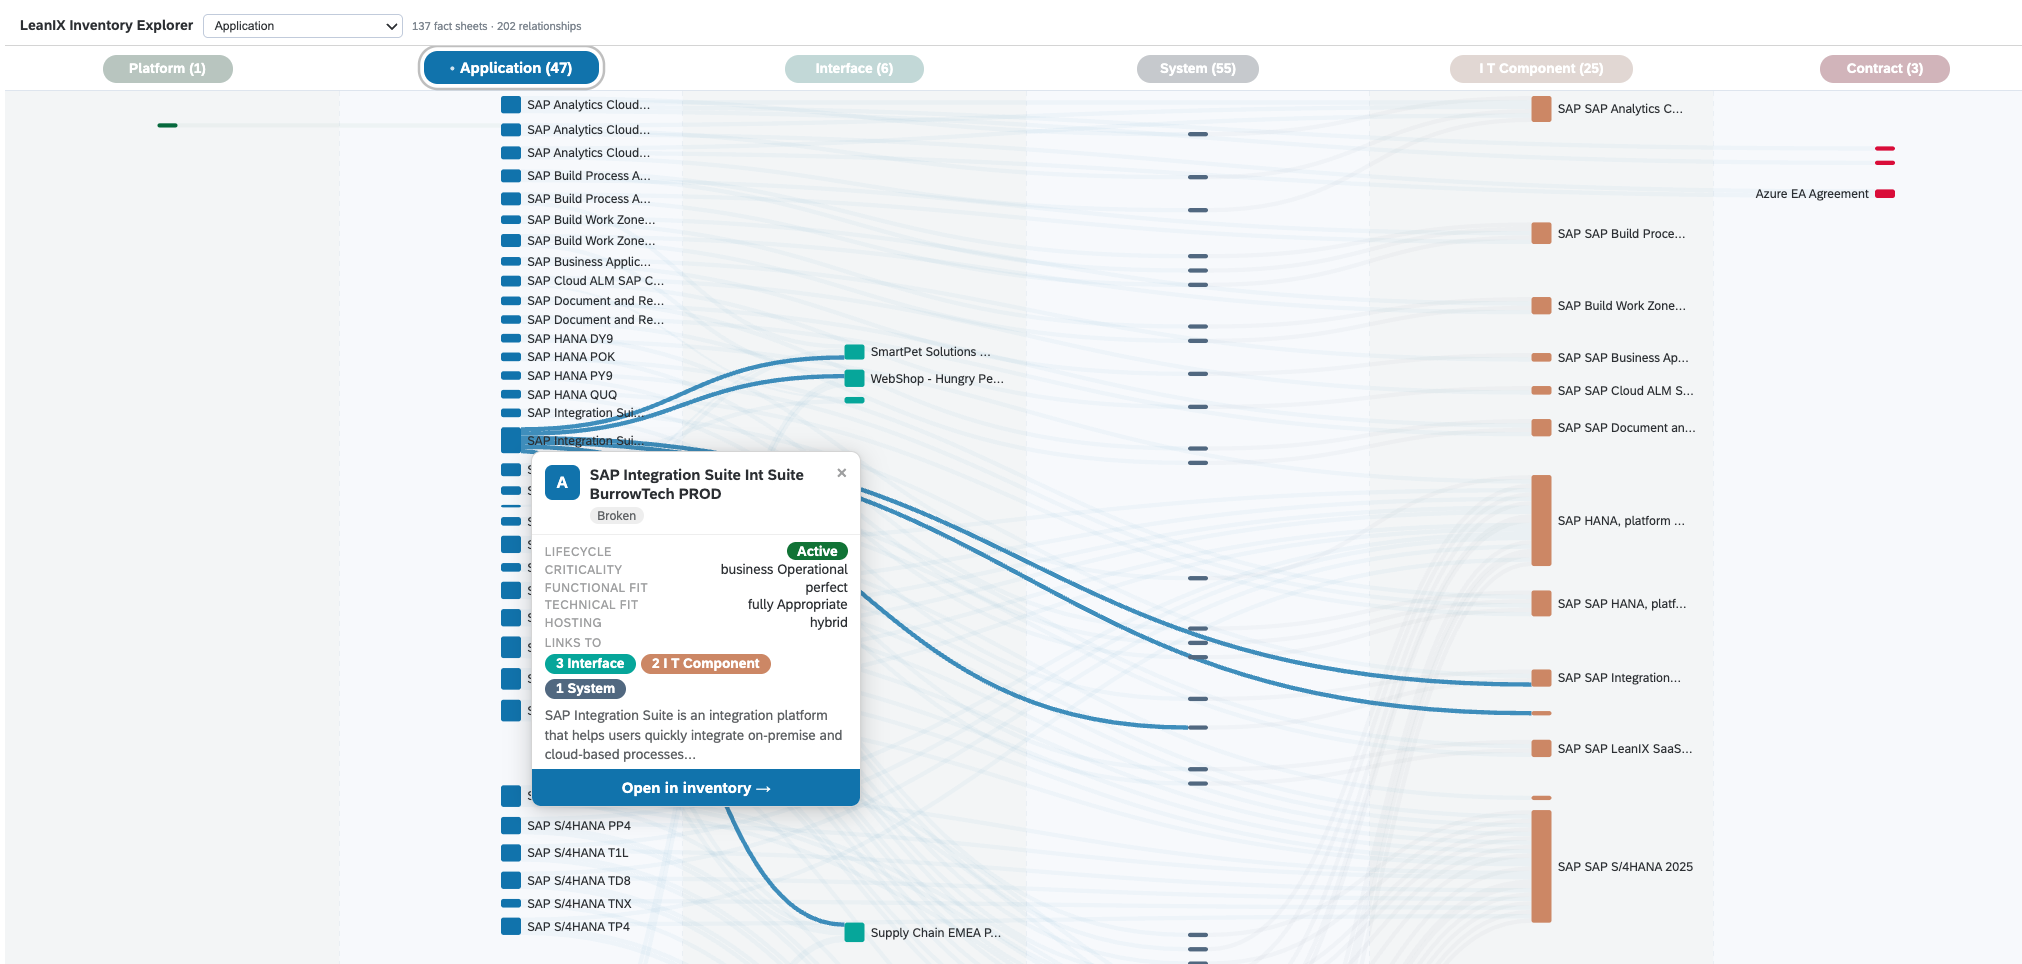
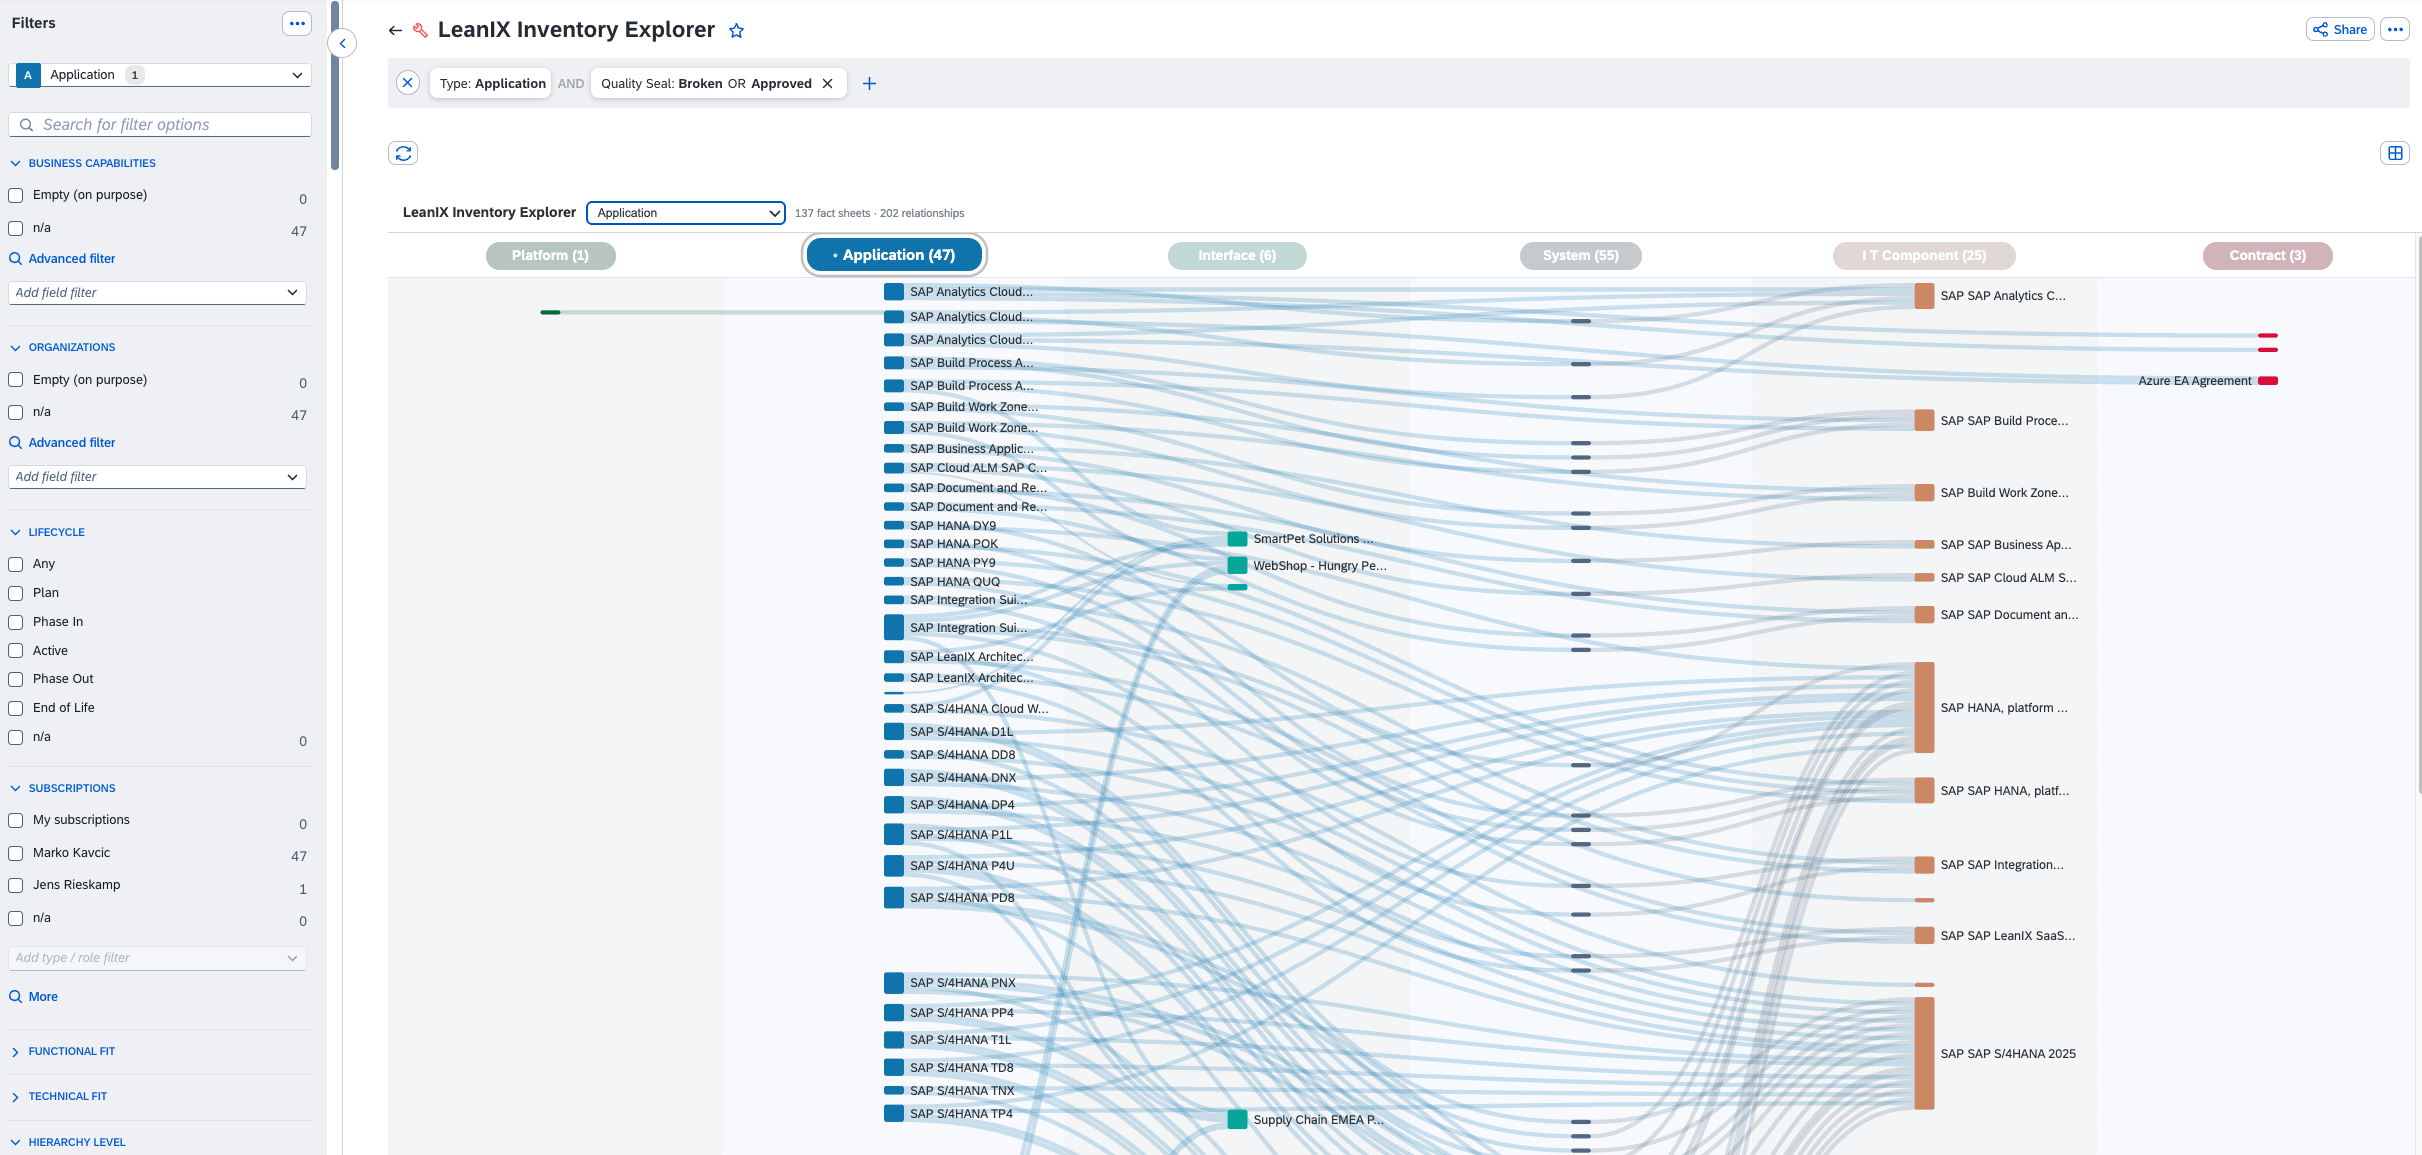
The LeanIX Inventory Explorer visualises how any fact sheet type connects to the rest of your workspace as an interactive Sankey diagram. Select a fact sheet type from the dropdown and the report dynamically discovers its relationships from your workspace meta model and renders all connected fact sheets as a flow diagram. No manual configuration needed: columns, connections, and fact sheet types are built at runtime from your live workspace data.
Details
- Open the report from the Reports section in your workspace.
- Use the dropdown in the report header to select a fact sheet type (e.g. Application, System, Interface).
- The diagram renders all fact sheets of that type and their connected neighbours across related columns.
- Use the left-panel filters to narrow down by lifecycle, tag, subscription, or other attributes.
- Hover any node to highlight its upstream and downstream flows.
- Click a node to pin a detail card showing lifecycle, business criticality, related connections, and an Open in inventory button.
- SAP LeanIX workspace (any edition)
- Fact sheets with relationships defined in the workspace meta model
- Admin or read access to the workspace
Disclaimer
This report is provided for informational purposes only. It performs read-only operations on your SAP LeanIX workspace data. The author accepts no liability for any decisions made based on the visualizations produced by this report. This report dynamically queries your workspace on load. In workspaces with a large number of fact sheets, initial loading may take a few moments.