Technical Stack Dashboard Report
Add to
Sign In
Use Your LeanIX Workspace
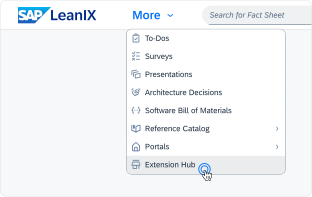
Click 'More' in the main navigation, then select 'Extension Hub'.
You will be signed in automatically.
Change Log
No version history available.
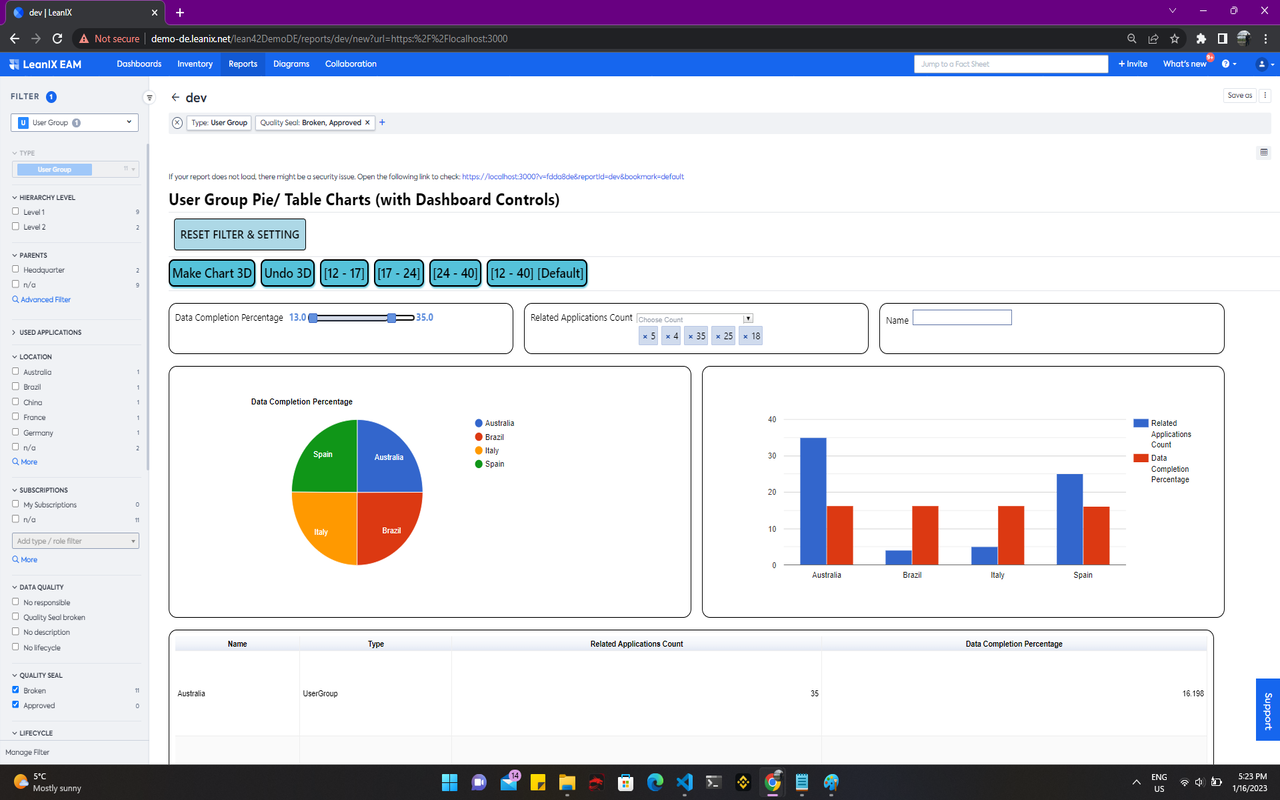
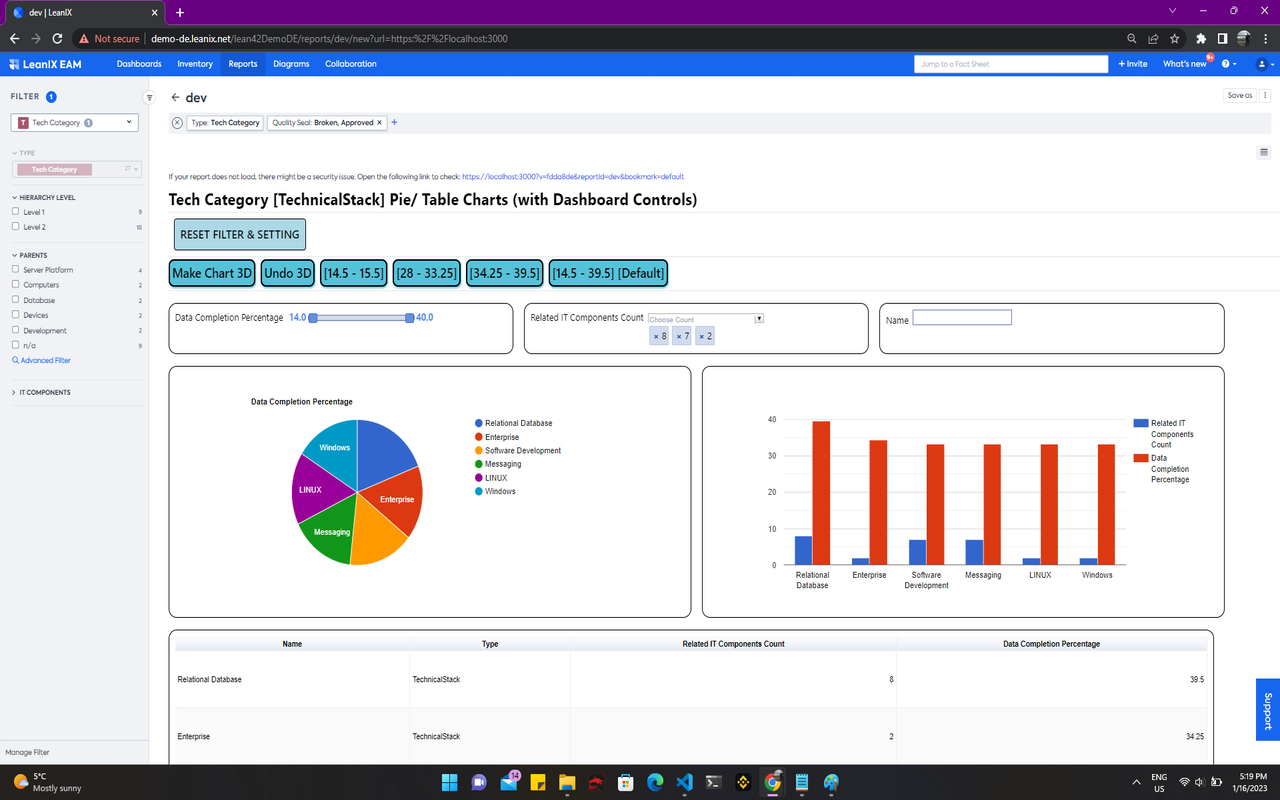
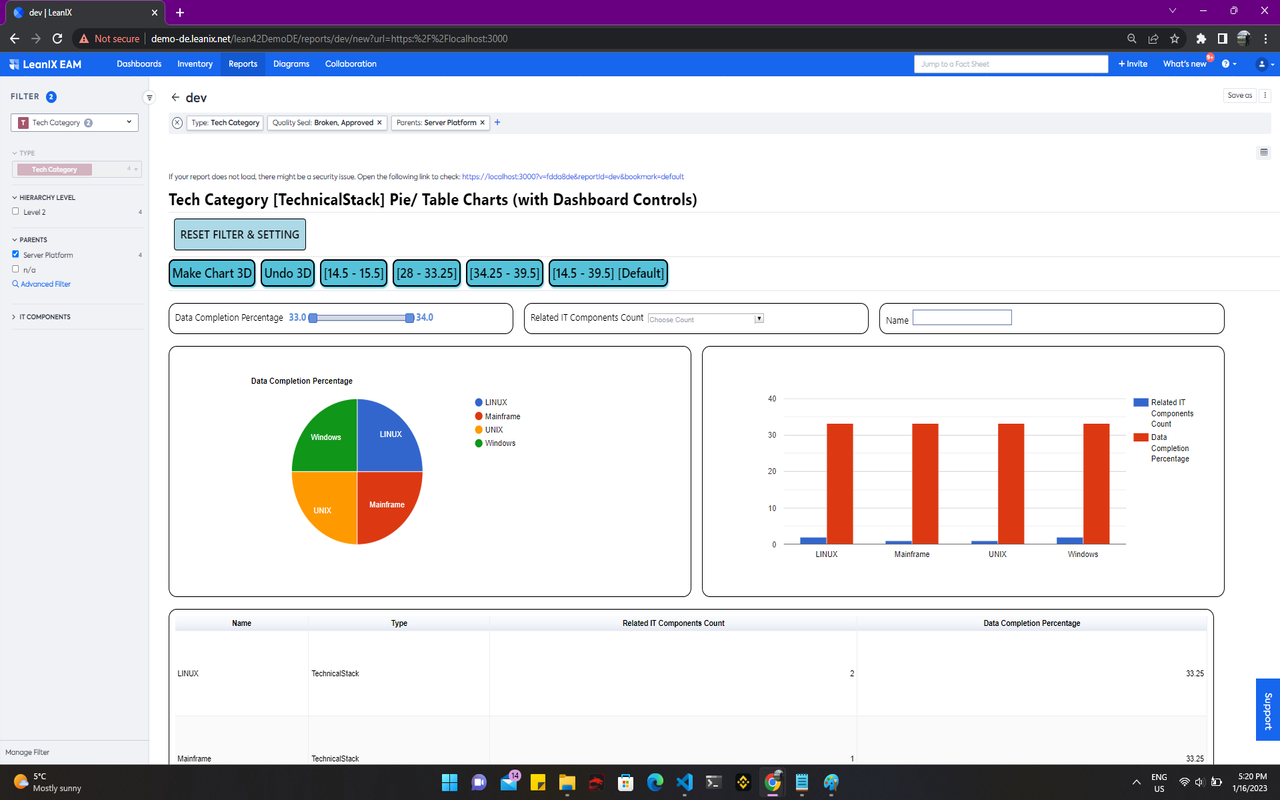
The Technical Stack Dashboard Report, is essentially a dashboard configured by the Google Charts API to make use of more than one charts and have custom controls that can affect the appearance and data used to reproduce the charts used by the respective dashboard. This dashboard report makes use of custom queries aimed at providing fact sheet type specific relations and data needed for each respective dashboard (based on fact sheet type). At the upper right corner of the screen there is a "Settings" button which allows for the adjusting of the dashboard according to a specifically picked fact sheet type. The dashboard itself makes use of a Pie Chart, Combo Chart and a Table Chart along with controls such as Data Range Slider, Search Bar and drop-down selection. The chart can be adjusted according to one's preference. Most of the controls refer to Data Completion ranges while two of them are associated with the appearance of the Pie Chart.
Details
The report is configured automatically and supports all fact sheet types. In order to be presented with a visualization of a respective dashboard, navigate to the "Settings" button at the upper right corner of the screen and pick a fact sheet type from the scrollable selection. Above the chart/ report there is a reset button named "RESET FILTER & SETTING" which resets the dashboard settings by removing the fact sheet type selection and re-displaying the "Settings" button at the upper right corner as well as removing facet filters. The report makes use of the out of the box filtering and bookmarking as well as some custom controls configured with google chart API to influence the dashboard. These custom control adhere to changing chart style as well as data ranges, with intent to influence visualization and provide options. There is a Data Completion Percentage range slider as well as a drop-down selection for filtering dashboard items based on amount of related applications and a search bar that filters based on fact sheet name.
Configured data fields and specific tags are not required by this report. All Fact Sheets data is required for this report as well as custom queries tailored for each individual dashboard choice. The report does not make use of any mutations.